
What is LINEST in Google Sheets?
The LINEST function in Google Sheets is used for linear regression analysis. It returns statistics that show the relationship between two sets of given data points. This function is useful for statistical analysis of two different variables when we wish to derive the relationship between them and identify trends or predict future values. It returns a set of values portraying the slope and intercept of the linear equation that best fits the data.
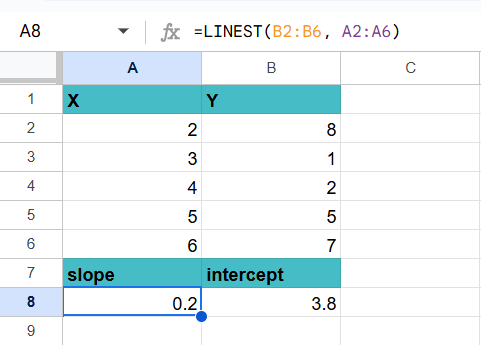
In the example shown below, Column A contains the x-values while Column B contains the y-values. To calculate the slope and intercept of the line nest fitting the given data, use the following formula:
Use this LINEST in Google Sheets Template to follow along with the examples in this article.
Download Excel Template=LINEST(B2:B8, A2:A8)
It will return an array where the first value represents the slope of the line and the second shows the intercept.
Key Takeaways
- LINEST is a function that performs linear regression analysis. The LINEST formula calculates the slope, intercept, and other statistical values of a linear regression model.
- It helps you find the equation of a line that best fits a given set of values, and shows how strong that relationship is.
- It requires a range of independent and dependent variables as input.
- Depending on the arguments used, LINEST returns the slope (m) and the intercept (b). If you set the verbose parameter to TRUE, LINEST returns a matrix with multiple values.
Syntax
LINEST returns multiple values. Hence, there should be a range of cells for the results when you use the LINEST in Google Sheets formula. The syntax of the function is as follows:
=LINEST(known_data_y, [known_data_x], [calculate_b], [verbose])
- known_data_y: The range of known y-values in y = mx + b.
- known_data_x: The set of known x-values. If this argument is omitted, it gives x = 1, 2, 3, … for each y value.
- calculate_b: A logical value, if TRUE, calculates the y-intercept (b) of the line. If FALSE, the y-intercept is 0.
- verbose: A logical value, if TRUE, returns the slope, y-intercept, and additional regression statistics. If FALSE, only returns the slope (m) and y-intercept (b) of the line from the form y = mx + c.
How to Use LINEST Google Sheets Function?
The LINEST function in Google Sheets calculates the line of best fit for a given set of values and returns the slope, intercept, and R-squared value.
Below, let us look at how to use the LINEST function in Google Sheets.
Step 1: Go to the Google Sheets file containing the data as shown below.

Step 2: Type “=LINEST(“ and enter the array of cells with the known values for the y-values. Then, select the range of known values for the independent variable, x.
=LINEST(B2:B7,A2:A7, TRUE, TRUE)
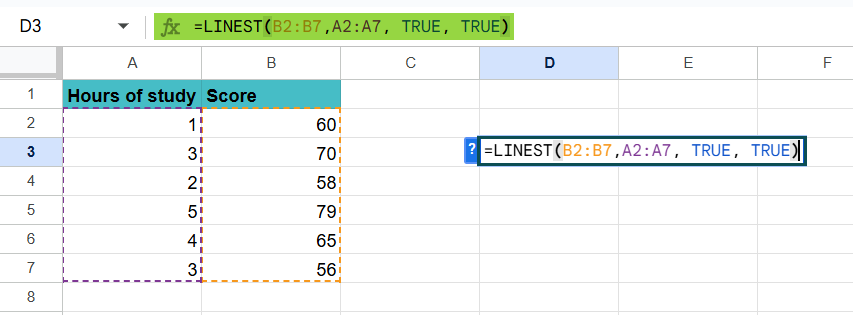
Step 3: Press Enter or Ctrl+Shift+Enter in some versions to input it as an array formula. The first cell in the range shows the slope of the regression line. The second cell in the top row gives the y-intercept, indicating the expected test score when study hours are zero.
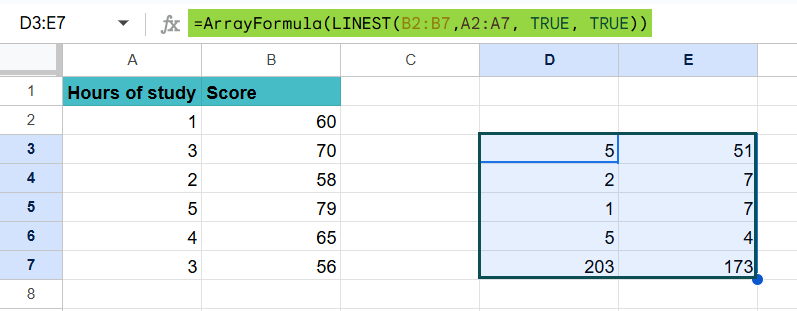
After pressing Enter, you’ll see a 2×5 matrix. Here’s what they stand for:
Column 1 Column 2
Slope Intercept
Standard Error of the Slope Standard Error of the Intercept
R-squared Standard error
F-statistic Degrees of Freedom
Regression Sum of Squares Residual Sum of Squares
Using the Google Menu bar
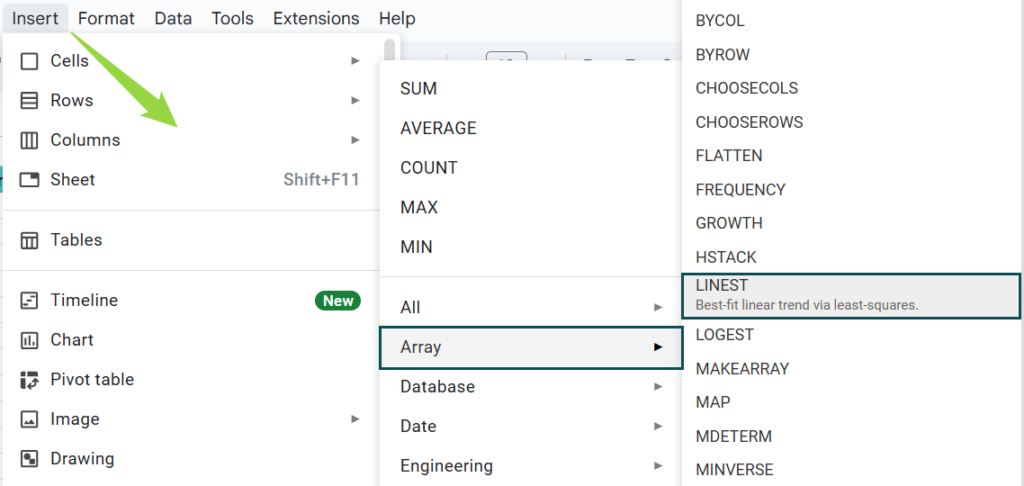
- We can also enter the same function using the Google Menu bar.
- Go to the menu bar and click on “Insert” ➝ “Function” ➝ “Array” ➝ “LINEST.”
- Enter the required arguments. Close the bracket and press the “Enter” key.
Examples
The LINEST function in Google Sheets helps you perform linear regression analysis on data like student study hours and exam scores. It helps you understand the relationship between two variables and makes predictions based on the regression line.
Let us look at how to apply them in different examples.
Example #1 – Simple Linear Regression
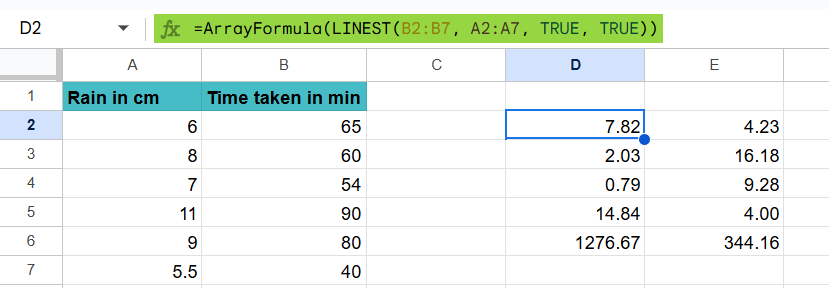
The LINEST function can be used to perform linear regression analysis, as shown in the example below. The table shows the amount of rainfall received by a city on different days and the time taken by a commuter to reach home.
Here, you have data for the independent variable (X), rainfall, and the dependent variable (Y), time taken, and you want to find the linear relationship between them.
Step 1: Enter the following formula in cell D2.
=LINEST(B2:B7, A2:A7, TRUE, TRUE)
- B2:B6: The range of the dependent variable.
- A2:A6: The range of the independent variable.
- TRUE: The TRUE indicates that Google Sheets should calculate the y-intercept.
- TRUE: It means the formula should return additional regression statistics.

Step 2: Press Enter or Ctrl + Shift + Enter based on your Google Sheets version to make it an array formula
| Column 1 | Column B |
|---|---|
| Slope coefficient | Intercept coefficient |
| Standard Error of the Slope | Standard Error of the Intercept |
| R-squared | Standard error |
| F-statistic | Degrees of Freedom |
| Regression Sum of Squares | Residual Sum of Squares |
Here’s how we interpret the results.
- R Square: 0.79. Here, around 79% of the variation in the time to reach can be explained by the rainfall received.
- Standard error: 2.03. Here, the observed values fall an average of 4.2 units from the regression line.
- Coefficients: The coefficients help us write the regression equation. Using the above results, we write it as:
- Time to reach = 4.23 + 7.8*(cm)
We interpret the coefficient for rain as meaning that for each centimeter of additional rain, the time to reach increases by 7.8 minutes on average. The coefficient for the intercept means that the expected time to reach for zero rain is 4.23 minutes.
Example 2 – Multiple Linear Regression
Let us take multiple variables for the above example. Suppose we want to know if the rainfall amount and the number of main lanes (which helps commuters travel in a more expansive space) affect the time it takes to reach the destination.
To find this relationship, we find the multiple linear regression using rain in cm and a number of main lanes as explanatory variables and time taken in min as a response variable.
Step 1: We apply the following formula to perform multiple linear regression using the dataset as shown below.
=LINEST(C2:C7, A2:B7, TRUE, TRUE)

Step 2: Let us interpret the result after pressing Enter.
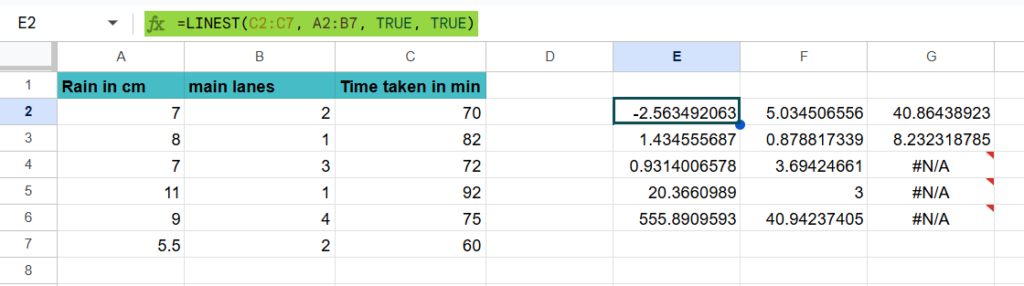
R Square: 0.931. 93.1% of the variation in the time taken can be explained by the rain and main lanes taken.
Standard error: 3.69. Here, the observed values fall an average of 3.69 units from the regression line.
Estimated regression equation: We can use the coefficients from the output of the model to create the following estimated regression equation:
Exam score = 40.86 + 5.03*(rain) – 2.5*(lanes)
We can use this estimated regression equation to calculate the time taken to travel based on the rainfall and the number of main lanes. For example, a person who travels during 7 cm of rain and takes three main lanes is expected to reach at 68.57 minutes.
Exam score = 40.86 + 5.03*(7) – 2.5*(3)
Example 3 – Calculating the Standard Error
Let us look at the first example as an extension of how to find the standard error.
We have the table as shown in the image below.

Step 1: As shown above, let us look at what these values represent.
| Column 1 | Column B |
|---|---|
| Slope coefficient | Intercept coefficient |
| Standard Error of the Slope | Standard Error of the Intercept |
| R-squared | Standard error |
| F-statistic | Degrees of Freedom |
| Regression Sum of Squares | Residual Sum of Squares |
Here, the Standard Error of the Slope and the Intercept help you understand the reliability of your model’s coefficients. A larger standard error means less reliability.
Standard Error of the Slope – 2.03
It is a lower value that suggests that the estimated slope is more reliable.
Standard Error of the Intercept (16.18):
A smaller value means the intercept estimate is more accurate. Here, the standard error of the intercept is 16.18, which is slightly higher and hence less accurate.
Important Things to Note
- Once you have the slope and intercept, you can make predictions based on your regression model.
It uses historical data to predict future outcomes like sales and exam scores.
Frequently Asked Questions (FAQs)
1. In a linear regression model, which has only one set of variables, the known x and y values can be of any shape but should have the same number of rows and columns.
2. For multiple regression analysis, the known_y’s must be a vector.
3. When the const argument is TRUE, the c value or intercept is calculated and included in the equation: y=mx + c. If const is FALSE, the intercept is considered zero and omitted from the equation: y=mx.
4. The accuracy of the output of the LINEST function depends on the dispersion of data points. The more linear the data, the more accurate the results.
Some of the errors when using the LINEST function include:
#REF error which occurs if the known_x’s and known_y’s ranges have different dimensions.
If the LINEST function returns a single value. chances are that it is entered as a regular formula, not an array formula. Press Ctrl + Shift + Enter in that case.
#VALUE! error occurs if known_x’s or known_y’s contains at least one blank cell or any other text value which is not a numeric value.
To force the regression line to go through the origin and have no intercept, set the calculate_b argument to FALSE.
For example, =LINEST(B2:B1-, A2:A10, FALSE, TRUE)
Now, the intercept is 0 and returns the slope of the regression line without an intercept term.
Use this LINEST in Google Sheets Template to follow along with the examples in this article.
Download Excel Template