
What Is NORM.S.INV Function In Excel?
The NORM.S.INV function in Excel determines the antipode of the standard normal cumulative distribution for a specified probability value where the dataset has a 0 mean and a standard deviation value of 1.
The NORM.S.INV function is an inbuilt Statistical function, so we can insert the formula from the Function Library or enter it directly in the worksheet. Users can apply the NORM.S.INV() to assess how an investment portfolio behaves based on fund deposits and withdrawals.
Use this NORM.S.INV Function In Excel Template to follow along with the examples in this article.
Download Excel TemplateFor example, the below table shows probability values for different datasets. We will determine the z-value (the standard normal deviation) in column B, such that NORM.S.DIST(z,TRUE) = probability (given data) for each dataset using the NORM.S.INV formula.

Select cell B2, enter the formula =NORM.S.INV(A2), press “Enter”, and drag the formula from cell B2 to B5 using the fill handle.

The output is shown above. Column C is for our reference. Here, the function accepts the specified probability value and gives the z-value in the corresponding target cell in each row.
Key Takeaways
- The NORM.S.INV function in Excel calculates the antipode of the standard normal cumulative distribution for the given probability value. And the function is useful for reviewing stock portfolios based on units purchased and sold.
- We see that the function accepts only one mandatory argument, probability, as input.
- The NORM.S.INV() is the obverse of the NORM.S.DIST function when the cumulative argument value in the NORM.S.DIST function is TRUE.
- In hypothesis testing, we can apply the NORM.S.INV() to determine the Z-critical value for the specified significance level.
NORM.S.INV() Excel Formula
The syntax of the NORM.S.INV Excel Formula is,

The argument of the NORM.S.INV Excel Formula is,
- probability: The probability value that pertains to a standard normal cumulative distribution. It is a mandatory argument.
How To Use NORM.S.INV Excel Function?
We can use the NORM.S.INV() in Excel in 2 ways, namely,
- Access from the Excel ribbon.
- Enter in the worksheet manually.
Method #1 – Access from the Excel ribbon
Choose the target cell for output → select the “Formulas” tab → go to the “Function Library” group → click the “More Functions…” option drop-down → click the “Statistical” option right arrow → select the “NORM.S.INV” function, as shown below.

The Function Arguments window appears. Enter the argument in the Probability field → click OK

Method #2 – Enter in the worksheet manually
- Choose the target cell for the output.
- Type =NORM.S.INV( in the cell. [Alternatively, type =N or =NORM and double-click the NORM.S.INV function from the Excel suggestions.]
- Enter the argument as a cell value or reference and close the brackets.
- Press Enter to execute and get the required probability value.
We will find to calculate the z-values for the specified probability values using the NORM.S.INV function in Excel.
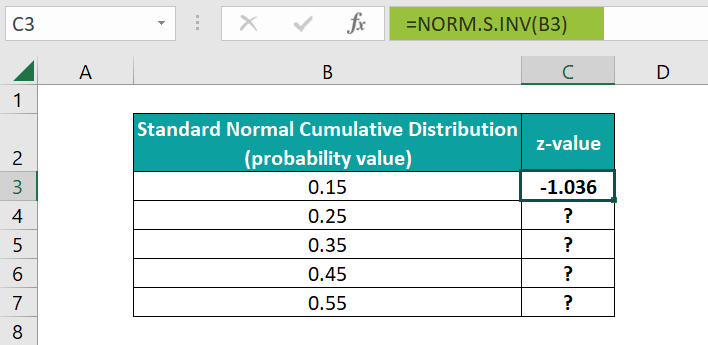
The below table shows a set of probability values for standard normal cumulative distributions.

The steps to calculate using the NORM.S.INV formula are,
- Select cell C3, and enter the formula =NORM.S.INV(B3)

- Press Enter to view the z-value in the target cell. The result is “-1.036”, as shown below.
[Alternatively, the other way to find NORM.S.INV function in Excel is to go to Formulas → More Functions → Statistical → NORM.S.INV to apply it in the chosen cell C3.
The above step will open the Function Arguments window. Enter the cell reference to the given probability value in the specified field.
Finally, once we click OK, the window will close, and we will obtain the NORM.S.INV() output.] - Drag the formula in the remaining target cells C4:C7 using the fill handle.
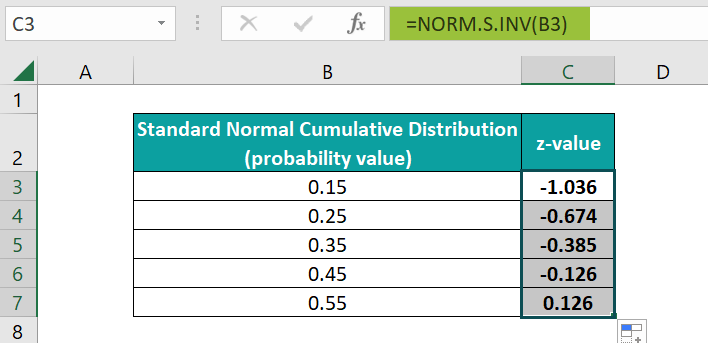
The output is shown above.
Examples
We will consider some advanced scenarios using the NORM.S.INV function examples.
Example #1
The following table shows a set of z-values in column B. And column C contains the corresponding standard normal cumulative distribution data determined using the NORM.S.DIST() for a cumulative value of TRUE.

The steps to confirm the z-values for the probability values specified in column C are the same as those provided in column B using the NORM.S.INV formula are,
- Step 1: Select cell E3, enter the formula =NORM.S.INV(C3), and press Enter. The result is “1.1”.

- Step 2: Using the excel fill handle, drag the formula to cells E4:E6. The output is shown below.

[Output Observation: Thus, the example proves that the NORM.S.INV() is the obverse of NORM.S.DIST(). But the cumulative argument in the NORM.S.DIST() should be TRUE, as only then will the function return a cumulative distribution.]
Example #2
The first table contains the inputs required to determine the standard normal cumulative distribution by applying the NORM.DIST() and NORM.S.DIST().
We will first apply the two distribution functions in cells C7:C8 to verify if they return the same probability values for the specified mean and standard deviation data.
And then, we will check if we obtain the given x-value (cell C3) as the required z-value for the determined probability value by applying the NORM.S.INV function in Excel cell C9.

The steps to check for the above requirements are as follows:
- Step 1: Select cell C7, enter the NORM.DIST() formula =NORM.DIST(C3,C4,C5,TRUE), and press Enter. The result is “0.999968”, as shown below.

- Step 2: Select cell C8, enter the NORM.S.DIST() formula =NORM.S.DIST(C3,TRUE), and press Enter. The result is “0.999968”, as shown below.

- Step 3: Select cell C9, enter the NORM.S.INV() formula =NORM.S.INV(C8), and press Enter. The result is “4”, as shown below.

[Output Observation: The two distribution functions return the same probability value. The reason is that the mean value is 0, and the standard deviation is one in the cumulative distribution.
And the NORM.S.INV() accepts the NORM.S.DIST() output as the required probability value to return the z-value of 4. The result equals the specified x-value, 4, for which we calculated the normal distribution.]
Example #3
We will compare the test stat with the Z-critical value during hypothesis testing to evaluate the statistical significance. And if the absolute value of the test statistic exceeds the Z-critical value, it implies statistical significance.
So, based on the above concept, let us see an example considering a dataset with a significance level of 0.01 or 99% confidence level.
Suppose we must perform three tests, mentioned in the second table, and determine the Z-critical value in each case.

The steps to apply the NORM.S.INV() in cells C5:C8 to obtain the required data are,
- Step 1: Select cell C5, enter the formula =NORM.S.INV(C2), and press Enter.
For the Left-tailed test, we can utilize the specified significance value as the required probability argument in the NORM.S.INV(). And it returns the Z-critical value as -2.32634, as shown below.

- Step 2: Select cell C6, enter the formula =NORM.S.INV(1-C2), and press Enter.
In the case of the Right-tailed test, we must subtract the significance level from one and pass it as the NORM.S.INV() argument. And the function returns a Z-critical value of 2.32634, the mirror image value of the Left-tailed test Z-critical value, as shown below.

- Step 3: Select cell C7, enter the formula =NORM.S.INV(C2/2), and press Enter.

- Step 4: Select cell C8, enter the formula =NORM.S.INV(1-C2/2), and press Enter.

As the third test is a Two-tailed test, we divide the significance value by two. And the two cells, C7 and C8, give the left- and right-hand tail Z-critical values, respectively.
Important Things To Note
- When applying the NORM.S.INV function in Excel, ensure the mean value and the standard deviation of the dataset are 0 and 1, respectively. Only these values indicate that the specified probability value corresponds to a standard normal cumulative distribution.
- For a non-numeric probability value, the NORM.S.INV() returns the #VALUE! error.
- Ensure the supplied probability argument value is between 0 and 1. Otherwise, the NORM.S.INV() will throw the #NUM! error.
Frequently Asked Questions (FAQs)
The NORM.S.INV() is in the Formulas tab in Excel. We can select the target cell and navigate the path Formulas → More Functions → Statistical → NORM.S.INV to apply the function in the chosen cell.
The NORM.S.INV() behaves in the following way when the specified probability is 0.5. Let us see the steps with an example to determine the z-value for the specified probability.
The below table contains the probability value corresponding to the normal distribution.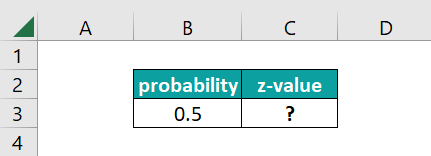
The procedure to execute the NORM.S.INV() in the target cell and achieve the required data is,
Select cell C3, enter the NORM.S.INV() formula =NORM.S.INV(B3), and press Enter.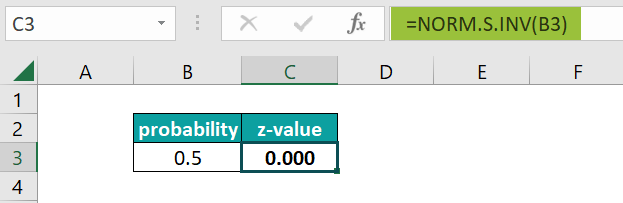
Thus, the NORM.S.INV() returns a standard normal deviation of 0 for a probability of 0.5.
When the specified probability in the NORM.S.INV() in Excel is below 0, 0, 1, more than 1, or a text value, the function returns errors.
For example, the table below contains probability values.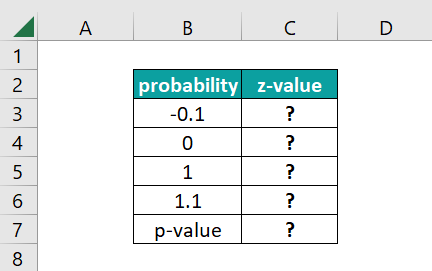
The steps to apply the NORM.S.INV() in the target cells and obtain the required data are,
• Step 1: Select cell C3, enter the NORM.S.INV() formula =NORM.S.INV(B3), and press Enter.
The result is a “#NUM!” error, as shown below.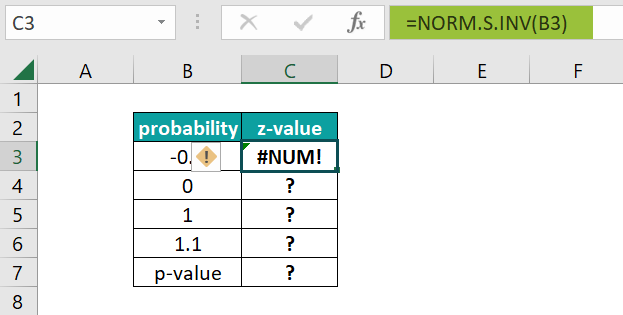
• Step 2: Use the fill handle, and drag the formula in cells C4:C7. The output is shown below.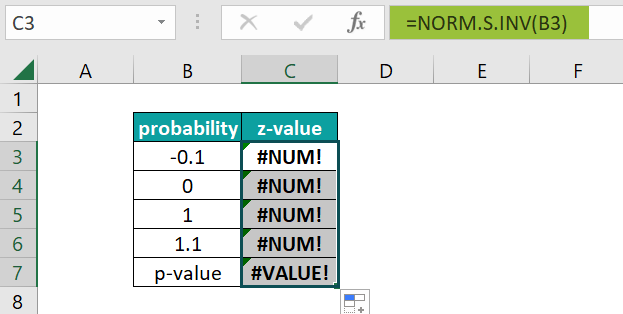
[Output Observation: The above example shows that for a probability value of less than 0, 0, 1, and greater than 1, the NORM.S.INV() returns the #NUM! error. And when the specified probability value is non-numeric, the NORM.S.INV function returns the #VALUE! error.]
The precision of the NORM.S.INV() depends on the correctness of the NORM.S.DIST function.
And the NORM.S.INV() utilizes the iterative search approach. The function output is the #N/A error if the search does not converge after 100 iterations.
Use this NORM.S.INV Function In Excel Template to follow along with the examples in this article.
Download Excel TemplateRecommended Articles
Continue with these related resources when you want the next practical step in this topic.
- Statistics In Excel
- Descriptive Statistics in Excel
- Standard Deviation In Excel
- MEDIAN Excel Function
- MODE Excel Function
Explore the full Excel Statistical Functions guide or browse Excel Resources.