
What Is Organizational Chart In Google Sheets?
The Org Chart or the Organizational Chart in Google Sheets, is a graphical representation of an organization’s structure or hierarchy. It displays the different levels of positions or line of authority in a firm, from the highest level to the lowest available level.
Using a Google Sheets Organizational Chart, the users get a clear understanding of the roles and responsibilities, different departments of the organization and the tasks related to each level.
Use this Organizational Chart In Google Sheets Template to follow along with the examples in this article.
Download Excel TemplateFor example, the below table consists of different employees and their reporting managers. We will create an Organizational Chart.

Select cell range A2:B6 and enter the Organizational Chart from the charts group.

The generated Organizational Chart is shown above. We see the CEO is at the top of the hierarchy, followed by the reporting managers and the employees reporting to the CEO and the managers.
Key Takeaways
- The Organizational Chart in Google Sheets graphically represents the data as a hierarchy, from the top level to the bottom level of roles in a specific organization.
- The Org Chart in Google Sheets looks similar to a Pyramid or a Tornado Chart.
- Ensure to link the data in the columns to each other. Or else we will have separate charts that are not linked at all.
- Using the Org Chart, we can create corporate hierarchy, educational hierarchy, business hierarchy, etc.
- We can format or customize the chart according to our requirements or highlight the columns in a presentable way, while generating reports.
- We can publish our Org charts and convert the charts to MS Excel as well.
How To Create Organizational Chart In Google Sheets?
The steps to create Organizational Chart in Google Sheets as follows:
Step 1: We need a maximum of two Columns to create an Org Chart. Therefore, organize the dataset that the first column has the Job structure available in the company, such as different designations, departments, employees, managers, etc. And in the second column add the data, on how column is linked till the upper-level role or the top level.
Step 2: Next, choose the entire dataset or a cell range excluding the headers. Select the “Insert” tab – choose the “Chart” option.

Step 3: A default chart, i.e., the “Column chart” appears. Then the “Chart editor” window opens on the right-side.

Step 4: To select the Org Chart, select the “Setup” menu, click the “Chart type” drop-down. Select the “Organizational Chart” from the “Other” section, as shown below.

Finally, we will have the Organizational Chart. We can then customize it as per our requirements.
Examples
Let us use some Organizational Chart in Google sheets examples such as, the school management and corporate hierarchy and create an Org chart, learn to publish it and to save it as an Excel file.
Example #1 – Show Organization Hierarchy
We will create an Organizational Chart for a corporate hierarchy for the data given below.

The steps to create a Google Sheets Organizational Chart are,
Step 1: Choose the cell range A2:B13 –select the “Insert” tab – choose the “Chart” option, the “Chart editor” window opens on the right-side and select the “Organizational Chart”, as shown below.

The chart generates as shown below.

Step 2: There are not many options to customize, unlike other Charts, where we can add titles, change font styles, background colors, etc. We only have the “Org” option. Therefore, in the “Chart editor” under the “Customize” menu, select the “Org” option, as shown below.

Step 3: Select the “Medium” option from the “Size” option drop-down, choose the required color from the “Node color” drop-down and choose the required color from the “Selected node color” drop-down, as shown below.

We get the final Organizational Chart, as shown below.

The nodes appear in the applied color. However, the “Operations” is in blue color. This is because we choose the color “Blue” for the “Selected node color” drop-down. Therefore, whenever, we select node of the hierarchy, it will turn blue indicating that that particular node is selected.
Example #2 – Publish an Organizational Chart
Now that we have created a Google Sheets Org Chart, let us see how we can publish the same.
The steps to Publish an Organizational Chart are,
Step 1: In the worksheet containing the created Org Chart, select the “File” tab – click the “Share” option right-arrow – select the “Publish to web” option, as shown below.

Step 2: The “Publish to the web” window appears. We have the “Link” and the “Embed” tabs. Click the “Link” tab, we see two drop-downs, as shown below.

Step 3: Click the “Entire Document” drop-down and select the “Example 2”, as shown below.

Step 4: Click the “Web page” drop-down. Select the “Web page” and click the “Publish” option, as shown below.

Step 5: The moment we click the “Publish” button, a pop-up appears as, shown below. Click “OK”.

Step 6: We get the following data with the link of our published data, for further usage.

Let us check the link. Copy the link and paste it in a web browser. Then we will get the web page, as shown below.

We can switch between the tabs to view our google spreadsheet.
Example #3 – Save an Organizational Chart as Excel File
The steps to Save an Organizational Chart as Excel file are as follows,
Step 1: In the worksheet containing the created Org Chart, select the “File” tab – click the “Share” option right-arrow – select the “Publish to web” option, as shown below.

Step 2: The “Publish to the web” window appears. We have the “Link” and the “Embed” tabs. Click the “Link” tab, we see two drop-downs, as shown below.

Step 3: Click the “Entire Document” drop-down and select the “Entire Document”, because for Excel conversion, we cannot select only the worksheets, as shown below.

Step 4: Click the “Web page” drop-down. Select the “Microsoft Excel (.xlsx)” and click the “Publish” option, as shown below.

Step 5: The moment we click the “Publish” button, a pop-up appears as, shown below. Click “OK”.

Step 6: We get the following data with the link of our published data, for further usage.

Let us check the link. Copy the link and paste it in a web browser. Then we will get the web page, as shown below.

We have got an MS Excel file. We can switch between worksheets to view the examples and their respective data.
Example #4 – Show Organization Hirearchy of a School
We will create an Organizational Chart for a school management hierarchy for the data given below.

The procedure to create a Google Sheets Organizational Chart is,
Choose the cell range A2:B11 – select the “Insert” tab – choose the “Chart” option, the “Chart editor” window opens on the right-side and select the “Organizational Chart”, as shown below.

The chart generates, as shown below, after apply certain formatting.

Important Things To Note
- Ensure the source data contains smaller datasets to avoid the data to move out of the chart layout.
- We can generate a chart in multiple ways, namely,
- First, select the cell range and then insert the chart. Then, we will get a default chart, after which we can select the required chart type. Or,
- We can first insert the required chart type, a blank chart appears with only a border, and then, enter the data range in the “Chart editor” window to get the required chart.
Frequently Asked Questions (FAQs)
An alternate way to insert an Organizational Chart in Google Sheets is,
First, select the dataset – click the “More” option on the toolbar, as shown below.
Next, click the “Insert chart” icon, as shown below, to open the “Chart editor” and we know the rest.
A few reasons the Google Sheets Organizational Chart may not work are,
a. The dataset used to generate the chart is modified or deleted.
b. The dataset is not organized in a right way and there is no link between the columns to get a proper hierarchy.
c. The cell range to generate the chart is not rightly selected, so that headers too have appeared, which is not required.
d. The Node size selected is “Large” and the nodes that moved out of the chart are not visible.
We can stop publishing the Google Sheets Organizational Chart as follows:
Once we are in the “Publish to the web” window, click the “Publish content & settings” option at the very end of the window.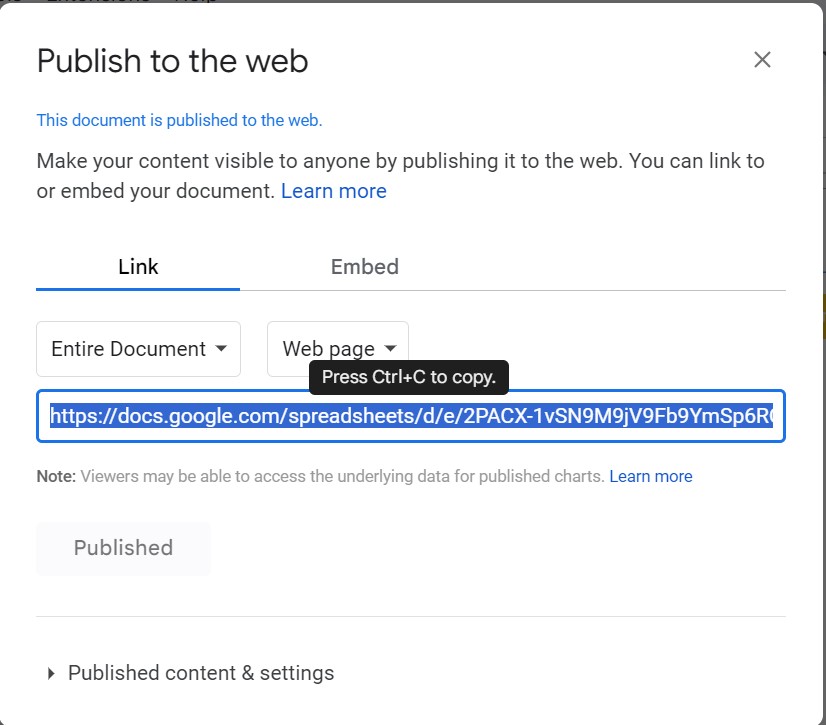
Click the “Stop Publishing” option. Also, to stop completely, we must uncheck the “Automatically republish when changes are made” option that is found at the very end of the window.
Use this Organizational Chart In Google Sheets Template to follow along with the examples in this article.
Download Excel Template