What is the Power BI DISTINCTCOUNT Function?
The Power BI DISTINCTCOUNT function is used to count the number of distinct values in a single column. You can use this function to create measures in Power BI for your reporting or data visualization requirements. You can also use DAX (Data Analysis Expressions) in combination with the Power BI DISTINTCOUNT function to create complex calculations or data aggregations.
Key Takeaways
- The Power BI DISTINCTCOUNT function is used to count the number of distinct values in a single column.
- It accepts column values as an argument and returns the distinct or unique count of rows that the column has available.
- You can use Power BI DISTINCTCOUNT to create calculated measures for your visualization requirements
- You can use the Power BI DISTINCTCOUNT with multiple filters, Power BI distinctcount multiple columns, Power BI distinctcount group by and Power BI distinctcount with condition for your visualization requirements.
- It can handle null values and can be used with date or time columns.
📊 Unlock Advanced DAX Skills in Power BI!
Take your Power BI skills to the next level with our Advanced DAX in Power BI Training Course. Dive deep into advanced DAX functions, complex calculations, and optimization techniques to enhance your data analysis and reporting capabilities.
Syntax
The syntax for the Power BI DISTINCTCOUNT function is outlined below:
DISTINCTCOUNT(<column>)
It accepts a single parameter that includes:
| Parameter Name | Mandatory/Optional | Description |
|---|---|---|
| Column | Mandatory | It contains the value of the parameter to be counted for calculation |

For example, the below measure provides the distinct sales orders for a company.
DistinctSalesOrders = DISTINCTCOUNT(‘Sales'[TransactionD])
How to use the Power BI DISTINCOUNT function?
To use Power BI DISTINCTFUNCTION, follow the steps highlighted below:
Step 1: Launch Power BI Desktop in your system.
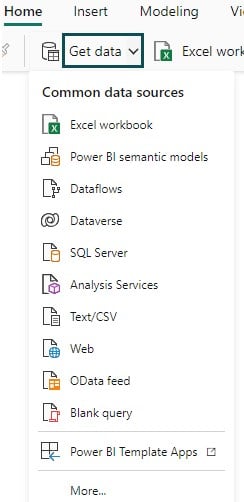
Step 2: Import the dataset into Power BI using the Get data option and load into Power BI using the Load button.
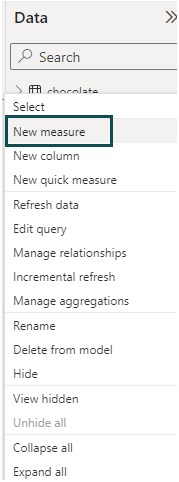
Step 3: Navigate to the Modelling tab and click on the New measure option.

Step 4: Write the DAX expression in the formula bar to create a measure for your reporting requirements.
Distinct Products Sold = DISTINCTCOUNT(financials[Product])

Click on the Commit icon to save the changes.
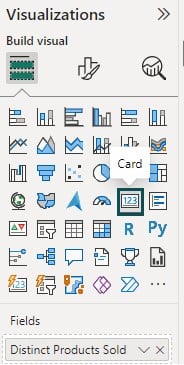
Step 5: Navigate to the Visualizations pane and choose the card visual icon. Drag and drop the measure to the report canvas or use it as part of your calculations.
The card visual looks like the one below in the report canvas.

You can also choose other visual options where you can use measures for your data visualization requirements. Alternatively, you can also the created measure to create a calculated column or other data aggregation functions for visualization.
Note: You can’t perform Power BI distinctcount multiple columns directly in Power BI. However, there are workarounds to perform similar activities using methods such as concatenation, Power Query, and other third-party tools.
You can apply Power BI distinctcount group by to perform distinct counts on grouped data. To apply this function, use the syntax provided below:
DemoDistinctGrouping =
SUMMARIZE(
<tableneme to be summarized>,
<groupcolumn1>, <groupcolumn2>, <groupcolumn3>,…,
<distinctcolumnname>, DISTINCTCOUNT(ColumnName)
)
For example, you can use the below syntax to create a measure DistinctCountByProductCategory
DistinctCountByProductCategory =
SUMMARIZE(
RetailSales,
RetailSales[ProductCategory],
“DistinctProductCount”, DISTINCTCOUNT(RetailSales [Product])
)
Similarly, you can use the Power BI distinctcount with the condition to create a distinct count based on specific criteria in Power BI Desktop.
For example, to calculate the unique count of sales orders in a book sales company, you can use the below syntax to use the Power BI distinct count with the condition.
DistinctSalesOrder =
CALCULATE(
DISTINCTCOUNT(Sales[TransactionID]),
FILTER(
Sales,
Sales[ProductID] = <Sales_Product_ID> &&
Sales[OrderDate] >= <Purchase_Date>
)
)
Examples
In this section, we will go through a few examples demonstrating the use of DISTINTCOUNT function in Power BI.
Example #1 – With multiple Filters
In this example, we will demonstrate the Power BI Distinctcount with multiple filters using the Chocolate Ratings dataset. The Chocolate Ratings dataset contains the ratings and quality of various chocolates from around the world.
To use the Power BI distinctcount with filter function, follow the instructions below:
Step 1: Import the dataset into Power BI using the Get data option and click on the Load button to load it into Power BI.

Step 2: Navigate to the Data pane. Select the table, right-click on it, and choose New measure from the context menu.
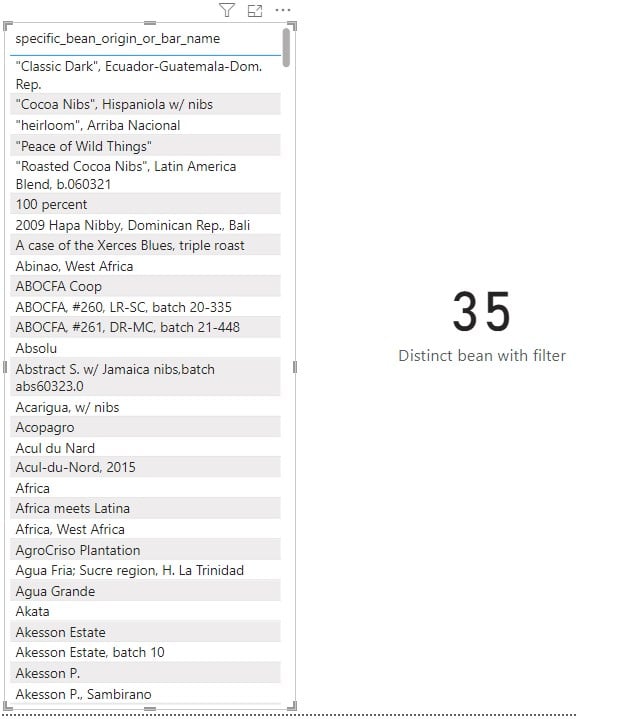
Step 3: In the formula bar, write the DAX expression to create a new measure. In this case, we have created a measure Distinct bean with filter to count the distinct number of chocolate bean names that have originated in France, Italy, and Brazil and have a user rating of greater than 3.
Distinct bean with filter = CALCULATE(DISTINCTCOUNT(chocolate[specific_bean_origin_or_bar_name]),
FILTER(chocolate,chocolate[country_of_bean_origin] IN {“France”,”Italy”, “Brazil”}),
FILTER(chocolate, chocolate[rating] > 3))

Click on the Commit icon to save the changes. This will create a measure for the chocolate table.
Step 4: Navigate to the Visualizations pane and select the card visual icon. Map the newly created measure to this card visual.
Step 5: Similarly, choose a Table visual from the Visualizations pane to create a Table visual using the underlying dataset.
Once the mapping is completed, you will see the data visualization in the report canvas as provided below:
Example #2 – With Filter non-blank
In this example, we will demonstrate the Power BI Distinctcount with filter non-blank using the Mountain Climbing Accidents Dataset dataset. The Mountain Climbing Accidents Dataset dataset contains information on climbers who tragically lost their lives while attempting to summit the iconic eight-thousanders.
To use the Power BI distinctcount with filter non-blank function, follow the instructions below:
Step 1: Import the dataset into Power BI using the Get data option and click on the Load button to load it into Power BI.

Step 2: Navigate to the Data pane. Select the table, right-click on it, and choose New measure from the context menu.

Step 3: In the formula bar, write the DAX expression to create a new measure In this case, we have created a measure of Distinct Cause of Death for Nationality to count the distinct number of causes of death that have Nationality in France, Russia, and the United States.
Distinct Cause of Death for Nationality = CALCULATE(DISTINCTCOUNT(‘deaths_on_eight-thousanders'[Cause of death]),
FILTER(‘deaths_on_eight-thousanders’,’deaths_on_eight-thousanders'[Nationality] in {“Russia”, “France”, “United States”}))

Click on the Commit icon to save the changes. It will create a measure for the chocolate table.
Step 4: Navigate to the Visualizations pane and select the card visual icon. Map the newly created measure to this card visual.
Step 5: Similarly, choose a Table visual from the Visualization pane to create a Table visual using the underlying dataset. Also, add a slicer visual from the Visualizations pane.
Once the mapping is completed, you will see the data visualization in the report canvas as provided below

Example #3 – With date filter
In this example, we will demonstrate the Power BI Distinctcount with a date filter using the SeriesReport-Seasonality Adjusted Sales dataset. The SeriesReport-Seasonality Adjusted Sales dataset contains the Monthly sales for retail trade and food services in the USA, adjusted and unadjusted for seasonal variations for various categories.
To use the Power BI Distinctcount function with a date filter, follow the instructions below:
Step 1: Import the dataset into Power BI using the Get data option and click on the Load button to load it into Power BI.

Step 2: Navigate to the Data pane. Select the table, right-click on it, and choose New measure from the context menu.

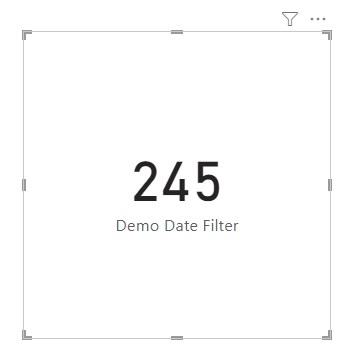
Step 3: In the formula bar, write the DAX expression to create a new measure. In this case, we have created a measure of Demo Date Filter to count the distinct number of sales that have occurred after 1st Jan 2000 onwards.
Demo Date Filter = CALCULATE(DISTINCTCOUNT(‘SeriesReport-Seasonally Adjusted Sales'[Sales – Monthly (Millions of Dollars)]),’SeriesReport-Seasonally Adjusted Sales'[Period] > DATE(2000,01,01))

Click on the Commit icon to save the changes. This will create a measure to the Demo Date Filter table.
Step 4: Navigate to the Visualizations pane and select the card visual icon. Map the newly created measure to this card visual.
Once the mapping is completed, you will see the data visualization in the report canvas as provided below.
Important Things to Note
- Power BI DISTINCTCOUNT accepts a column as an argument that can support any type of data.
- If this function doesn’t find any data i.e. no records to count, a blank value is returned. Else, it returns the distinct count of rows.
- Power Bi DISTINCTCOUNT function is not supported for use in DirectQuery mode when used in calculated columns or row-level security (RLS) rules.
- It counts unique values. For counting unique rows, use the COUNTROWS function.

Frequently Asked Questions (FAQs)
Yes, you can use DISTINCTCOUNT in calculated columns or measures. However, it’s primarily used in measures rather than calculated columns. You can use Power BI DAX in measures to count the unique values in a column. You can use the below syntax to create a measure:
DistinctSellers = DISTINCTCOUNT(‘Sales'[SellerID])
When it comes to calculated columns, creating new columns using the distinct count may not make a lot of sense or value adds. Evaluate your visualization requirements carefully before creating a calculated column using the DISTINCTCOUNT in Power BI.
DISTINCTCOUNT treats null values as a unique value. It counts null values for the calculation of distinct counts. If you want to skip the null values, you may use the DISTINCTCOUNTNOBLANK function.
Yes, you can use DISTINCTCOUNT with date or time columns. Note that, when you use DISTINCTCOUNT with date or time columns, it will count the number of distinct dates or times as provided in the column parameter. It will not count the number of rows.
The syntax to use DISTINCTCOUNTNOBLANK is as per below:
DISTINCTCOUNTNOBLANK (<column>)
Yes, you can combine DISTINCTCOUNT with other aggregation functions in the Power BI desktop application. For example, you can create a measure that calculates the distinct count of product names where the sales month is January.
The syntax for the same is provided below:
DistCountActiveMonths = CALCULATE(DISTINCTCOUNT(‘Net Sales Data'[Product Name]),FILTER(‘Net Sales Data’,’Net Sales Data'[Sales Month]=”January”))
Recommended Articles
This has been a guide to Power BI DISTINCTCOUNT. Here we explain the syntax, how to use it in Power BI, with examples, and points to remember. You may learn more from the following articles –

Leave a Reply