What is the Power BI Divide Function?
The Power BI DIVIDE function is used to perform the division of two measures. It returns an alternate result or BLANK() on division by 0, avoiding any errors that can be useful for continuity in calculations. DIVIDE function is a convenient way of performing division operations, eliminating the need to write any DAX expressions.
The Power BI DIVIDE function is specifically designed to handle the division by zero. It is very convenient to use and highly optimized for testing any denominator value as compared to the IF function. The results from the DIVIDE function can be a very concise and elegant expression.
Table of contents
Key Takeaways
- The Power BI DIVIDE function is a convenient way of performing divisions in Power BI. It is specifically designed to handle the division by zero case.
- It is very convenient to use and highly optimized for testing any denominator value as compared to the IF function.
- Power BI DIVIDE function has three parameters, i.e., two mandatory parameters (numerator and denominator) and one optional one (alternate result) that you can specify. If no alternateresult parameter is specified, then by default, BLANK is returned should it encounter a division by 0 cases.
- You can use the DIVIDE function with other Power BI functions such as CALCULATE, SUM, AVERAGE, etc.
📊 Unlock Advanced DAX Skills in Power BI!
Take your Power BI skills to the next level with our Advanced DAX in Power BI Training Course. Dive deep into advanced DAX functions, complex calculations, and optimization techniques to enhance your data analysis and reporting capabilities.
Syntax
The syntax for Power BI DIVIDE is outlined below:
DIVIDE(<numerator>, <denominator> [,<alternateresult>])
It comprises three parameters. The numerator and denominator parameters are mandatory, while the alternateresult parameter is optional.
- Numerator – It is the numerator or the number to divide
- Denominator – The divisor or number to divide by
- Alternateresult – This is the value that the DIVIDE function returns when it encounters a denominator with a 0 value, resulting in an error. If no alternate result parameter is provided, a default value, i.e., BLANK(), is returned.
For example, DIVIDE(18,4) will result in 4.5. However, DIVIDE(2,0) will result in BLANK.
If you would like to assign any alternate result, then it will return that value.
DIVIDE(2,0,0) will return 0 instead of BLANK.
In the next section, we will go through how to use this function.
How to use the Power BI Divide Function?
To use the DIVIDE function in Power BI, follow these steps:
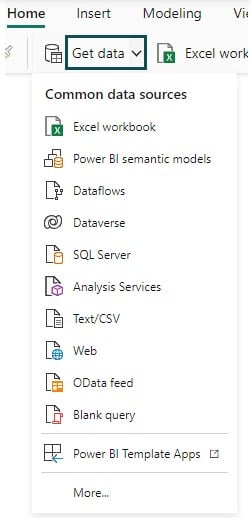
Step 1: Open Power BI Desktop. Import the dataset into Power BI using the Get data option.

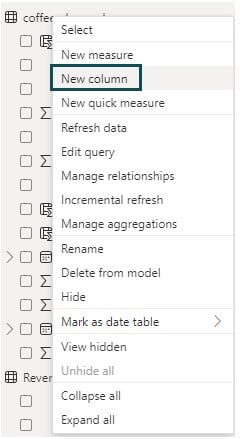
Step 2: Navigate to the Data pane. Select the table and right-click on it.
Step 3: From the contextual menu, choose the New column option. Enter the formula using the DIVIDE function in the formula bar.
Step 4: Specify the numerator and denominator parameters with appropriate data fields from the Data pane.
Step 5: Optionally, provide the alternateresult parameter should you wish to specify a default value for division by zero.
Step 6: Press Enter to create the new calculated column. Navigate to Data view to view the results of the DIVISION function stored in the newly created column.
Note: You can perform Power BI divide two measures, divide column by number, or divide measure. The syntax remains the same. For example, for Power BI divide two measures; you can create measures using the New measures option in Power BI and then use the DIVIDE function. Similarly, you can also use Power BI divide column by number or divide measure to create columns or measures as per your reporting requirements.
Examples
In this section, we will go through a few examples demonstrating the Divide function in Power BI.
Example #1 – Dividing Data by Time Intervals in Power BI
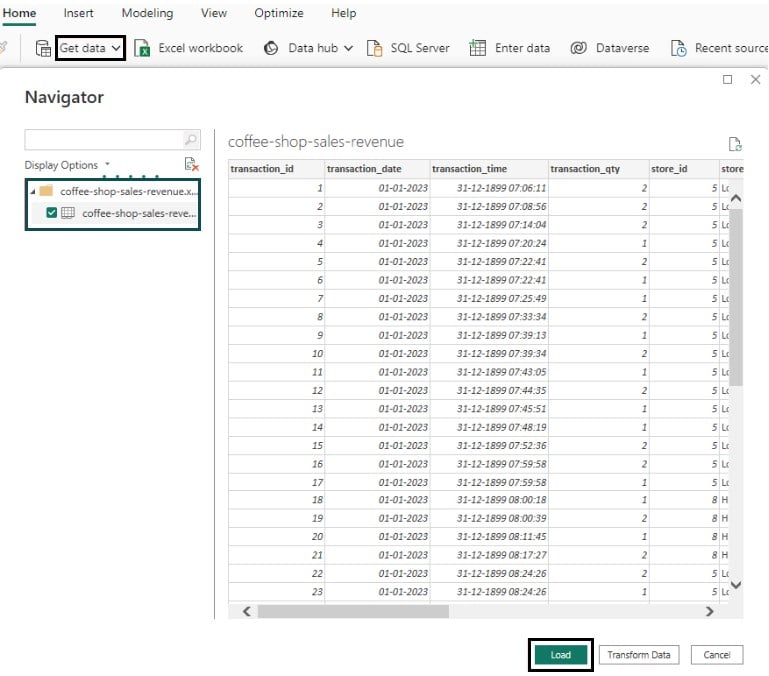
In this example, we will demonstrate dividing data by time intervals in Power BI using the coffee-shop-sales-revenue dataset. This dataset contains the sales details for a coffee shop across different product categories. To divide data by time intervals in Power BI, follow the instructions below:
Step 1: Import the dataset into Power BI using the Get data option and click on the Load button to load it into Power BI.

Step 2: Navigate to the Data pane. Right-click on the coffee-shop-sales-revenue dataset and select the New column option from the context menu.

Step 3: In the formula bar, write DAX expressions to create a new column.
Here we have created a new column, Total Product Revenue, for the corresponding date using functions like Power BI CALCULATE and SUM.
Total Product Revenue = CALCULATE(SUMX(‘coffee-shop-sales-revenue’, ‘coffee-shop-sales-revenue'[unit_price] * ‘coffee-shop-sales-revenue'[transaction_qty]), ALLEXCEPT(‘coffee-shop-sales-revenue’,’coffee-shop-sales-revenue'[transaction_date].[Date]))

Step 4: Click on Commit to save the changes.
Step 5: Repeat the same process as mentioned above to create a new column, the Total number of transactions on the date.
Total Number of transactions on the date = CALCULATE(COUNT(‘coffee-shop-sales-revenue'[transaction_id]), ALLEXCEPT(‘coffee-shop-sales-revenue’,’coffee-shop-sales-revenue'[transaction_date].[Date]))

Step 6: Save the changes by clicking on the Commit icon. Now, create another new column following the steps highlighted above.
Here, we have used the DIVIDE function to create Product Revenue per transaction column. Click on Enter to save the changes.
Product Revenue per transaction = DIVIDE(‘coffee-shop-sales-revenue'[Total Product Revenue],’coffee-shop-sales-revenue'[Total Number of transactions on the date],0)

Example #2 – Using the Divide Function to Divide Data in Power BI
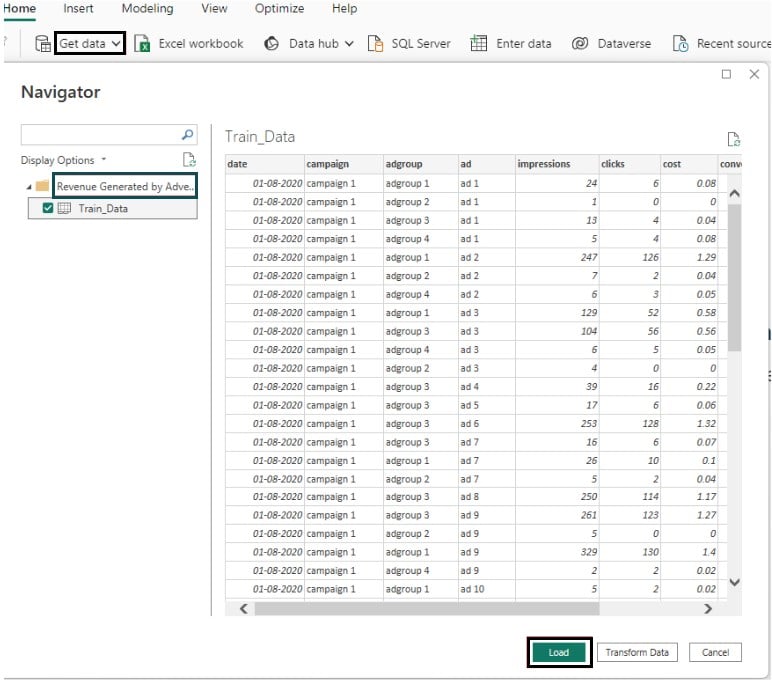
In this example, we will demonstrate using the DIVIDE function to divide data in Power BI using the Revenue Generated by Advertisements dataset. The Revenue Generated by Advertisements dataset contains financial details related to different adgroups and impressions/clicks associated with it.
To use the DIVIDE function to divide data in Power BI, follow the instructions below:
Step 1: Import the Revenue Generated by Advertisements dataset into your Power BI Desktop using the Get data option and load it into Power BI.

Step 2: Navigate to the Data pane. Select the Revenue Generated by Advertisements table in the Data pane. Right-click on the table and select the New column from the contextual menu.

Step 3: In the formula bar, write the formula specifying the DIVIDE function to calculate the cost per click. Here, we have calculated the cost per click by dividing the advertisement cost by clicks. We also have specified the alternateresult parameter as 0 to handle the Power BI divide by zero scenario.
Cost per click = DIVIDE(‘Revenue Generated by Advertisements'[cost],’Revenue Generated by Advertisements'[clicks],0)

Step 4: Click on the Commit icon once the formula is created to save the changes. Then, navigate to the Table view in the left-hand navigation of the Power BI window.
As you can see, the new column Cost per click is now added to the dataset, and the values are calculated as per the formula specified.

Example #3 – Dividing Data in Power BI Using DAX Formulas
In this example, we will demonstrate dividing data in Power BI using DAX formulas. For this demo, we will use the US electronic sale dataset. The US electronic sale dataset contains details on the sales data of different electronic gadgets such as laptops, TVs, phones, etc.
To use DIVIDE data in Power BI using DAX formulas, follow the instructions below:
Step 1: Import the US electronic sale dataset into your Power BI Desktop using the Get data option and load it into Power BI.

Once the data is successfully loaded into Power BI, you will be able to view it in the Data pane.

Step 2: Navigate to the Data pane. Select the US electronic sale table in the Data pane. Right-click on the table and select the New column from the contextual menu.

Step 3: Write the DAX formula highlighting the logic to calculate the Phone Sales as a percentage of total sales In the formula bar. The Phone Sales as a percentage of total sales attribute provides a view on the contribution of phone sales to the total electronic gadget sales. We also have specified the alternate result parameter as 0 to handle the Power BI divide by zero case.
Phone Sales as a percentage of total sales = DIVIDE(‘US electronics sales'[Phones],
‘US electronics sales'[Phones]+’US electronics sales'[Tvs]+’US electronics sales'[Laptops]+’US electronics sales'[Accessories],0)

Step 4: Click on the Commit icon to save the changes. It will create a new column for Phone Sales as a percentage of total sales to the US electronic sale table.
Step 5:
- Navigate to the Table view in the left-hand navigation of the Power BI window.
- As you can see, the new column Phone Sales as a percentage of total sales is now added to the dataset, and the values are calculated as per the formula specified.

Important Things to Note
- Power BI DIVIDE function is a handy tool to handle exception scenarios where the denominator is zero during a division operation.
- It allows the specification of alternate results to handle the Power BI divided by zero cases.
- Power BI DIVIDE only allows numeric values as input parameters. The DIVIDE function does not support non-numeric values.
- The alternateresult parameter can only be specified as a constant value. It doesn’t support any DAX expressions or non-numeric values.

Frequently Asked Questions (FAQs)
The Power BI DIVIDE function and the regular division operator (/) have some key differences as outlined below:
• The DIVIDE function is designed to automatically handle the division by zero case. In case the denominator is 0 or has a BLANK value, it returns
• BLANK if an alternate value is not passed
• Alternative value if passed as input parameter
• You gain significant performance improvement by avoiding the additional check to division by 0 which is an expensive task to perform.
• The DIVIDE function is convenient to use, has good readability, is easy to understand, and efficiently saves time by avoiding any requirement of testing the denominator value.
No, the alternate result parameter in the DIVIDE function cannot be a dynamic or variable value. The alternate result parameter divided by 0 must be a constant value. If you want a dynamic alternate result for scenarios like divide by 0 then explore options of using IF functions or create variables.
Yes, you can use the DIVIDE function with other Power BI functions such as AVERAGE, SUM, COUNT, FILTER, and CALCULATE to name a few.
For example, you can calculate the Sales Per Order using the DAX expression highlighted below:
Sales Per Order = DIVIDE( SUM( Sales[Amount] ), COUNT( Sales[OrderID] ) )
Similarly, you can use the CALCULATE function in combination with DIVIDE.
Percent_Of_Total_Gross_Sales = DIVIDE(SUM(Table1[Gross_Sales] ), CALCULATE(SUM(Table1[Gross_Sales] ), ALL(Table1)))
The DIVIDE function has a few limitations or caveats that you should be aware of. They include:
• The DIVISION function takes only numeric values as input parameters for the numerator, denominator, and alternate parameters. It can’t handle any non-numeric values or doesn’t support any DAX expressions.
• The alternative result parameter should be a constant value.
• For performing complex division, you may need to have a good understanding of DAX expressions.
Recommended Articles
This has been a guide to Power BI Divide. Here we explain how to use divide function in power bi, with syntax, examples, and points to remember. You may learn more from the following articles –

Leave a Reply