What is IF Statement in Power BI?
The Power BI IF statement is a conditional statement that allows you to perform different actions or calculations based on a specified condition. It is like the one used in MS Excel and commonly used in Power BI to create calculated columns, measures, or conditional formatting rules. You can use the Power BI IF statement either through DAX functions or in the Power Query tool for data transformation.
What is IF DAX Statements in Power BI?
In Power BI, DAX (Data Analysis Expressions) is a formula language used to define custom calculations and business logic. The IF DAX statement is a function that works like the Power BI IF statement, but it is specifically designed for use in DAX formulas.
The syntax of the IF DAX statement is as follows:
IF (LogicalTest, ResyltIfTrue, [ResultIfFalse])

The logicalTest is an expression that evaluates to either TRUE or FALSE.
If the logicalTest is TRUE, the ResultIfTrue expression is returned, otherwise, the [ResultIfFalse] expression is returned.
Table of contents
Key Takeaways
- The Power BI IF statements allow you to perform different actions or calculations based on a condition.
- The Power BI IF statement syntax is similar to the IF statement in other programming languages.
- DAX provides the IF function specifically for use in DAX formulas in Power BI.
- Understanding and using the Power BI IF statements effectively can help you create more dynamic and customized reports and visualizations in Power BI.
- You can use the Power BI IF statements from another table or with text or with multiple conditions to create a calculated column or measures in Power BI.
📊 Unlock Advanced DAX Skills in Power BI!
Take your Power BI skills to the next level with our Advanced DAX in Power BI Training Course. Dive deep into advanced DAX functions, complex calculations, and optimization techniques to enhance your data analysis and reporting capabilities.
Examples of IF DAX Statement in Power BI
In this section, we will demonstrate the IF DAX statement in Power BI through examples. You can use Power BI If statement from another table, Power BI If statement with multiple conditions, or Power BI If statement with 3 conditions to create a calculated column or measure in Power BI.
Example #1
Here, we will apply the Power BI IF Statement with multiple conditions to create a custom column YTD Return Category. We have used the Mutual Funds Benchmark Monitor dataset for demonstration purposes. To create this column, the steps followed are as follows:
Step 1: Open Power BI Desktop and load the dataset using the Data Connection.
Step 2: Create a new measure or calculated column by right-clicking on the table or column where you want to apply the IF function and selecting New Column.
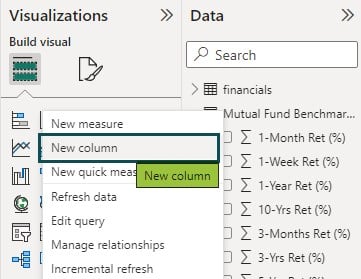
Step 3: In the formula bar, enter the DAX expression as shown below.
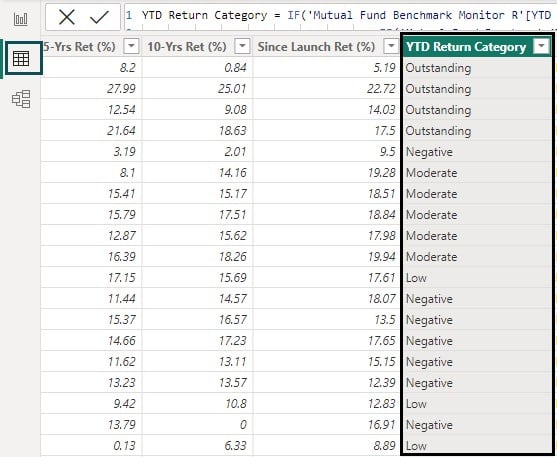
This DAX expression evaluates YTD Return values to classify the returns into Outstanding, Moderate, Low, and Negative categories.
YTD Return Category = IF (‘Mutual Fund Benchmark Monitor R’[YTD Ret (%)] > 15, “Outstanding”, IF(‘‘Mutual Fund Benchmark Monitor R’[YTD Ret (%)] > 5, “Moderate” IF(‘‘Mutual Fund Benchmark Monitor R’[YTD Ret (%)] > 0, “Low”, “Negative”)))

Save this DAX expression by clicking on the Commit icon. This would create a new column YTD Return Category in your data table. You can use this column in your reports or analysis in Power BI.
Step 4: Navigate to Report View in Power BI to view the values of this calculated column.
Example #2
This example demonstrates the use of the Power BI IF Statement from another table to create a column. Here we have used the Superstore dataset to create a column Returned Order in the Orders table using the Returned column in the Returns table. Superstore dataset has 3 different tables i.e. Orders, People, and Returns.
The steps followed to create this column are highlighted below:
Step 1: Import the Superstore dataset to Power BI using data connection and establish a data model between the Orders, People, and Returns table using Model View.
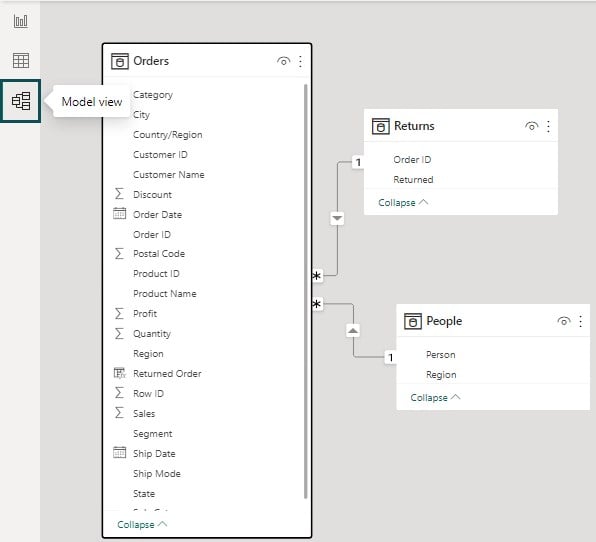
Step 2: Create a New Column on the Orders table either by choosing the New Column when you right-click on the Orders table or the New Column option in the Modeling tab
Here we have selected the earlier option as shown below.
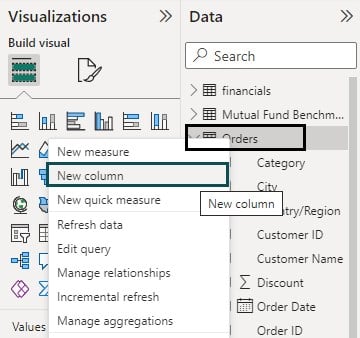
Step 3: Enter the column using the DAX expression in the formula bar and save the expression by clicking on the Commit icon.
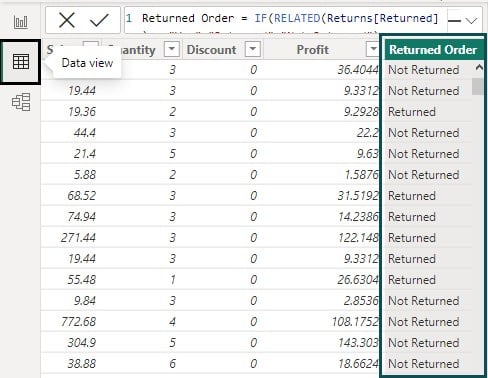
Returned Order = IF(RELATED(Returns[Returned]) = “Yes”,” Returned”,” Not Returned”)

If you notice, we have used the RELATED function in the DAX expression to create the Returned Order column in the Orders table. The RELATED function performs a lookup of the Order ID column to retrieve the value of the Returned column in the Returns table. However, for this lookup to work, a relationship must exist between the current table and the one with related information. Hence, we have established the relationship as part of Step 1 to define the relationship between the Orders, People, and Returns table.
This will create a new column of Returned Order in the Orders table visible in the Data pane.

Step 4: Navigate to the Data view to see the column values of the newly created column Returned Order in the Orders table.
Additionally, you can use a Power BI IF statement with text to define a new column or new measure in a table.
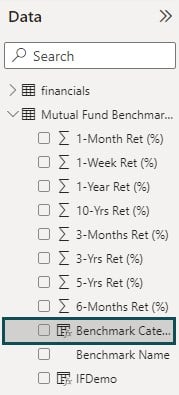
Here, we have created a column Benchmark Category to identify whether the benchmark index is a NIFTY or SENSEX based on the text value in the Benchmark Name column using the Mutual Funds Benchmark Monitor dataset. We have used a logical operator OR and a CONTAINSSTRING function to validate if any Benchmark Name contains the Nifty or NIFTY keyword. Accordingly, those Benchmarks will be categorized as NIFTY, and the rest will be tagged as SENSEX.
To use this Power BI IF statement with text, enter the DAX expression in the formula bar, as shown below:
Benchmark Category = IF(OR(CONTAINSSTRING(‘Mutual Fund Benchmark Monitor R’[Benchmark Name],”Nifty”), (CONTAINSSTRING(‘Mutual Fund Benchmark Monitor R’[Benchmark Name],”NIFTY”,”SENSEX”)

Post committing the DAX expression in Power BI, you will see the new column Benchmark Category in the Mutual Funds Benchmark Monitor table in the Data pane.
Similarly, you can also apply the Power BI IF statement with 3 conditions using logical operators in excel (AND, OR). For example, if you want to create a custom column for the mutual fund performance category based on 1 Yr, 3 Yr, and Yr returns, you can do so using the Power BI IF statement with 3 conditions, as shown below:
Mutual Fund Performance Category = IF(‘Mutual Fund Benchmark Monitor R’[1-Year Ret (%)] > 5 && ‘Mutual Fund Benchmark Monitor R’[3-Yrs Ret (%)] > 10 && ‘Mutual Fund Benchmark Monitor R’[5-Yrs Ret (%)] > 10,” Superior”,” Not Superior”)

Once you commit the DAX expression, you will see the newly created column in the Data pane. You will see the values in the new column by navigating to the report view section in Power BI.

You can also use the Power BI IF statement with multiple conditions to the DAX expression for creating a custom column or measure for Power BI reports for data analysis.
Important Things to Note
Important things to note when working with the Power BI IF statements BI include:
- The condition in the Power BI IF statement must be a logical expression that evaluates to either TRUE or FALSE. The Power BI IF statement can also return a BLANK value where no ResultIfFalse condition is defined.
- You can nest the Power BI IF statements within each other to create more complex conditions and calculations.
- It’s important to ensure that the ResultIfTrue and ResultIfFalse expressions are compatible in terms of data types and return the expected results. If these expressions are of different data types, then the IF function can return a variant data type.
- The Power BI IF statements can be used in calculated columns, measures, conditional formatting rules, and other calculations within Power BI.

Frequently Asked Questions (FAQs)
To use a Power BI IF statement in a custom column, you can follow these steps:
• Open your Power BI Desktop and go to the Data view.
• Select the table in which you want to create the custom column.
• Click on the Modeling tab in the ribbon at the top.
• In the Calculations group, click on the New Column button.
• In the formula bar that appears, write your Power BI IF statement using the Syntax: IFDemo = IF(‘Mutual Fund Benchmark Monitor R’[YTD Ret (%)] >= 0, “Positive Return”, ”Negative Return”)
• Press Enter to create the custom column
To perform multiple Power BI IF statements, you can nest them within each other.
You can create a measure or calculated column using the Power BI if statement with multiple conditions.
In the below example, we have created a calculated column YTD Return Category using Power BI IF statements based on YTD Return % in the Mutual Funds Benchmark Monitor dataset.
You can continue nesting the Power BI IF statements to handle additional conditions and values as needed.
Instead of using the Power BI IF statements, you can utilize the SWITCH function. The SWITCH function allows you to evaluate multiple conditions and return one of the multiple possible result expressions based on those conditions.
The syntax for the SWITCH function is as follows:
SWITCH(Expression, Value1, Result1, …, [Else])
In the below example, a calculated column of Quarters is created using the SWITCH function.
SwitchDemo = SWITCH(QUARTER(financials[Date]), 1, “Q1”, 2, “Q2”, 3, “Q3”, 4, “Q4”)![]()
If your Power BI IF statement is not working, there are a few possible reasons:
• Syntax errors: Check if you have written the Power BI IF statement correctly, including proper nesting and closing parentheses. Make sure all required commas and quotation marks are in place.
• Data type mismatch: Ensure that the data types of the condition, value_if_true, and value_if_false expressions are compatible. For example, comparing a text value with a numeric value may cause issues.
• Case sensitivity: Power BI is case-sensitive, so ensure that the condition and values are correctly spelled and capitalized.
• Null or missing values: Check if any of the involved columns or values have null or missing values. Handling null values appropriately in your Power BI IF statement can help avoid unexpected results.
• By reviewing these possible issues, you can identify and address the problem causing your Power BI IF statement not to work as expected in Power BI.
Recommended Articles
This has been a guide to Power BI IF Statement. Here we learn to apply IF DAX statement to perform multiple conditions, with examples. You can learn more from the following articles –

Leave a Reply