What Is Power BI Tutorial For Beginners?
Power BI Tutorial for Beginners is a step-by-step guide that introduces Power BI, a business intelligence and data visualization tool. It helps beginners learn how to use its features and functionalities.
Using this tutorial, you can learn Power BI tutorial step by step and understand its basic concepts and functionalities, enabling you to gain expertise on the tool.
Table of contents
Key Takeaways
- Power BI is a powerful business intelligence and data visualization tool developed by Microsoft.
- Power BI is available as a cloud-based service, a desktop application, and a mobile app.
- Power BI Desktop is a Windows application that provides a user-friendly interface for connecting to data sources, creating visualizations, and designing reports.
- To use Power BI Desktop, you need to download and install it on your Windows computer, and then connect to your data sources using the Get Data command.
- You can create visualizations in Power BI Desktop by dragging and dropping fields onto the report canvas and selecting the type of visualization you want to use from the visualization pane.
- Power BI can help you gain insights from your data, monitor KPIs and metrics, create interactive dashboards and reports, collaborate with others, and automate data refreshes and updates.
📊 Unlock Advanced DAX Skills in Power BI!
Take your Power BI skills to the next level with our Advanced DAX in Power BI Training Course. Dive deep into advanced DAX functions, complex calculations, and optimization techniques to enhance your data analysis and reporting capabilities.
What is Power BI?
Power BI is a cloud-based business intelligence and data visualization tool provided by Microsoft. It allows users to connect to various data sources, transform and model raw data, create interactive reports and dashboards, and share insights.
With Power BI, users can easily combine data from different sources, such as Excel spreadsheets, databases, and cloud-based services like Salesforce and Google Analytics. It can then be transformed and modeled to create interactive visuals and reports, which can be shared with other users in the organization.
Power BI also includes various features to help users gain insights from their data, including natural language processing, AI-powered visualizations, and predictive analytics. These features enable users to identify trends, uncover patterns, and make data-driven decisions.
The Availability of Power BI
Power BI is available in several versions, including:
- Power BI Desktop – A Windows desktop application that allows you to create reports and dashboards using data from various sources.
- Power BI Service – A cloud-based online software as a service (Saas) that allows you to share and collaborate on reports and dashboards created in Power BI Desktop.
- Power BI Mobile – Mobile apps for Windows, iOS, and Android devices that allow you to access and view Power BI reports and dashboards on your smartphone or tablet.
- Power BI Report Builder – Create paginated reports to share using Power BI Service
- Power BI Report Server – An on-premises solution that allows you to host and share Power BI reports within your organization.
Power BI can be accessed through a web browser or by downloading the Power BI Desktop or Mobile app from the Microsoft website.
It is available as a standalone service or as part of the Microsoft 365 suite of products.
Several pricing options are available for Power BI, including a free version with limited functionality and a paid version with more advanced features. The paid version is available on a subscription basis and can be purchased monthly or annually.Overall, Power BI is widely available and can be accessed by individuals and organizations of all sizes.
Getting Started with Power BI Desktop
To start with the Power BI Desktop, download and install it on your Windows PC. To download Power BI Desktop, navigate to the Power BI Desktop download page,
You can choose one of the below options, i.e., “Download free” or “See download or language options” to download the Power BI Desktop on your computer.

Post-download, you can install Power BI Desktop as an app from the Microsoft store, as shown below.
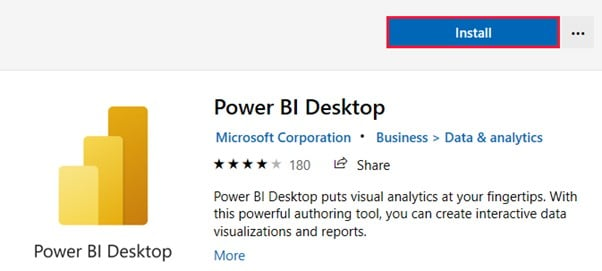
Once installed, you can launch it from the Start menu or double-click the Power BI Desktop shortcut on your desktop.
Power BI Desktop User Interface
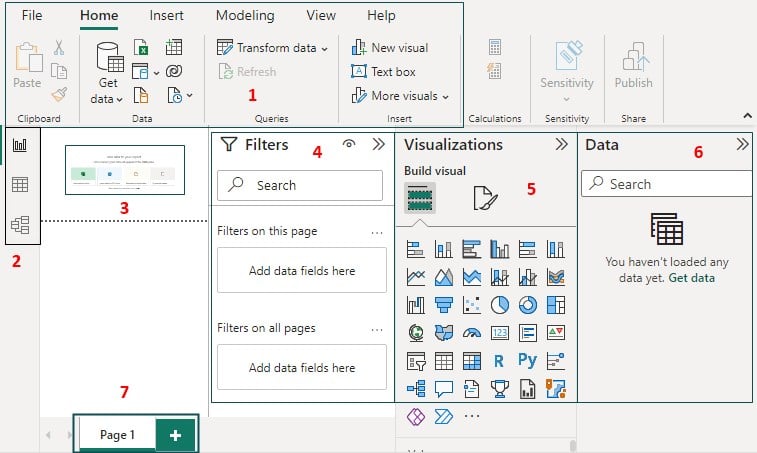
The Power BI Desktop user interface consists of several components, which include
- Ribbon – It displays common tasks associated with reports and visualizations such as Get data, Transform data, publish reports, etc.
- Views – There are three categories of views available in Power BI
- Report View – This allows you to create and view a report.
- Data View – This allows you to view the dataset.
- Model View – Displays tables, columns, and data relationships between the tables.
- Canvas – The middle area in Power BI GUI where you can build visuals by selecting the appropriate datasets.
- Filters Pane – Allows you to apply data filters
- Visualization Pane – Allows you to select from a list of visualization types, format reports, and drill down functionalities.
- Data Pane – Displays all the list of fields available in a dataset. You can drag the fields onto canvas, apply filters and then build visuals for reporting.
- Pages tab – Allows you to select or add report pages.
The Procedure for Uploading Data
To upload data to Power BI Desktop, you can use the Get data option on the Home tab of the ribbon.

It opens the Get Data dialog box, where you can select the data source you want to use, such as a file, a database, or a web service.
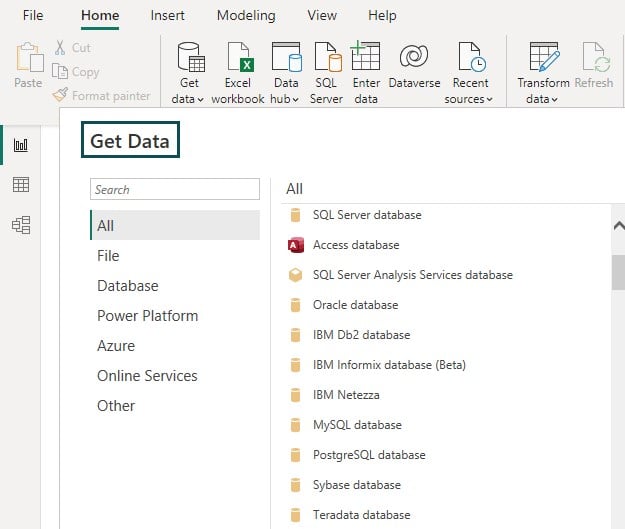
Once you select the data source, you must provide the necessary credentials and specify additional options, such as the tables or columns you want to use.
Alternatively, you can also directly select one of the data sources available in the Canvas of the Home page of the Power BI Desktop screen.
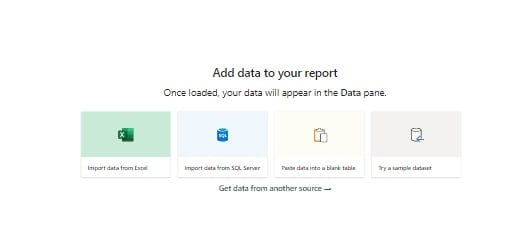
Once the data is loaded to Power BI Desktop, you can view the fields under the Data pane as shown below.
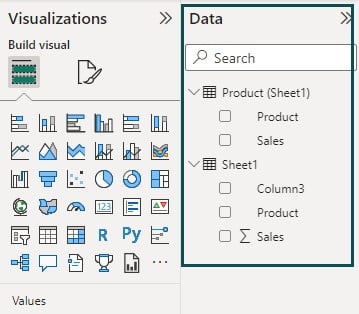
You can drag the appropriate data fields to the report canvas to build data visualization and interactive dashboards.
An Example of Creating Visualizations
To create visualizations in Power BI Desktop, drag and drop fields from the Fields pane onto the report Canvas, then select the visualization type from the Visualization pane. For example, you can create a bar chart in excel, a line chart in excel, or a pie chart in excel and customize its appearance and behavior using the formatting options and the visualization settings. Let us understand this through the below example in Power BI Desktop.
The example below will create a different visualization using the financial data. As observed, the Data pane has all the fields available with the financial dataset. Here are the steps to create the visualization.
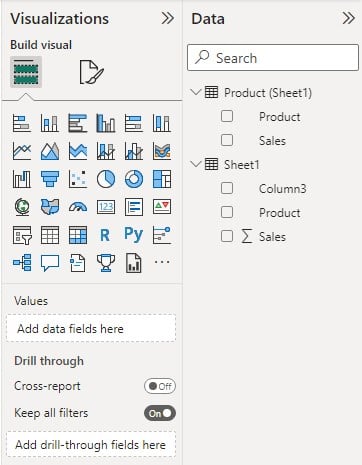
Step 1: Drag the fields from the Data pane onto the report canvas. Here we have dragged the Sales and Product fields from the Data pane. Power BI has created a column chart to show the sales per product category.

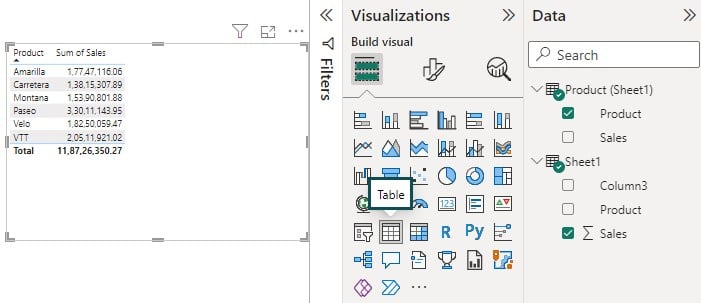
Step 2: Select the visualization type to Table. You will see the visualization changing to a table format.
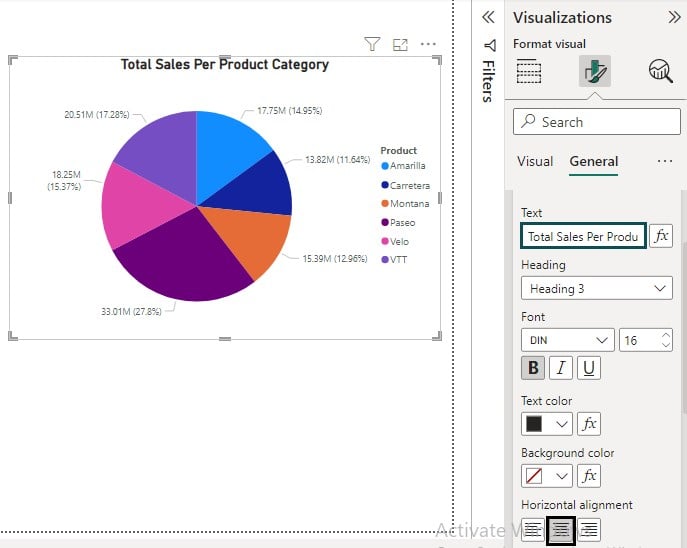
Step 3: Change the visualization to a Pie chart. You will see the visualization in a Pie chart showing the distribution of Sales per product.

Step 4: Click on Format your Visual option to customize the appearance and behavior.

Change the Title from Sum of Sales by Product to Total Sales Per Product Category and align it to the center using the Horizontal alignment option.
Step 5: Drag the Country field to the Filters pane to include only the sales data for the USA country. You will see the visualization changing to show the sales data for the USA.

You can further customize the visualization by adding more data fields from the Data pane to the report canvas or creating new attributes for visualization.
The Reasons for Using Power BI
There are multiple reasons for using Power BI which include:
- Flexibility to connect with a wide variety of data sources and perform data analysis
- Provides a range of visualization options that can be customized to meet specific needs.
- Gain insights from your data and make informed decisions with real-time analytics.
- Monitor and analyze key performance indicators (KPIs) and metrics.
- Create interactive dashboards and reports through self-service data visualization that can be shared with others through email or publishing reports to the Power BI service.
- Automate data refresh with one click at any chosen frequency and save time and effort in data preparation and cleaning.
- Use and share multiple workbooks in a single view in real time with multiple users.
- Provides enterprise-level security and compliance features, including data encryption, multi-factor authentication, and data loss prevention.
Important Things to Note
- Power BI offers various pricing options, including a free version with limited functionality and paid options with additional features and capabilities. Licensing options include per-user or capacity-based pricing.
- Power BI can be integrated with other Microsoft products, including Excel, SharePoint, Teams, and third-party applications such as Salesforce and Tableau.
- Power BI offers various learning resources, including documentation, Power BI tutorial videos, and a community forum where users can ask questions and share best practices. Microsoft also provides training and certification programs for Power BI.

Frequently Asked Questions (FAQs)
The ease of learning Power BI depends on the individual’s prior experience with data analysis and visualization tools. For beginners, Power BI may have a learning curve. Still, it has a user-friendly interface, and Microsoft provides extensive documentation, Excel Power BI tutorials, and resources to help users learn how to use it effectively. With practice and familiarity, users can become proficient in using Power BI.
Yes, Power BI Desktop is free to download and use on a Windows computer. However, the Power BI Service, which provides additional features such as collaboration, sharing, and data refresh schedule, requires a subscription.
Power BI is not part of Office 365, but it can be integrated with other Microsoft services such as Excel, SharePoint, and Teams. It is a separate application developed and maintained by Microsoft’s Power BI team.
Power BI is important because it enables businesses and organizations to turn raw data into meaningful insights that drive informed decision-making. With its powerful data analysis and visualization capabilities, Power BI can help businesses identify trends, monitor performance, and gain a competitive edge. Power BI can also improve team collaboration and communication by providing a common platform for data analysis and reporting. Additionally, Power BI can save time and effort in data preparation and cleaning by automating data refreshes and updates. Overall, Power BI is an important tool for businesses and organizations looking to make the most of their data and stay competitive in today’s data-driven world.
Recommended Articles
Guide to Power BI Tutorial. Here we provide a complete tutorial for Power Bi for Beginners (user interface, visualizations). You can learn more from the following articles –

Leave a Reply