
What is Power BI Quick Insights?
Power BI Quick Insights is a feature in Power BI offered by Microsoft that generates informative visuals based on underlying datasets using advanced analytical algorithms. These insights provide intuitive ways of visualization that can help users uncover trends in their datasets. Power BI produces quick insights on your existing semantic models published to Power BI Service.
The Quick Insights feature creates different insight cards and allows user interactivity through different functionalities such as pin visual to a dashboard, creating insights for the insight card, and apply filters to the insights. Depending on the underlying dataset, Quick Insights can produce up to 10 different types of insight cards ranging from outliers, correlation, and low variance to trends, and seasonality in your dataset.
In the next section, we will see how you can use these insights in your visuals.
Key Takeaways
- Power BI quick insights feature offered by Microsoft in Power BI highlights any trends or patterns in your underlying data.
- It generates different types of insights using a set of advanced machine learning and statistical algorithms on your semantic models published to the Power BI Service.
- You can generate Quick Insights only for the data imported into Power BI.
- While you can’t customize the Power BI Quick Insights, you can use some of the user interaction features such as Pin visual, generate insights for an insight card, apply filters, and export the datasets.
- Understand the limitations of Power BI Quick Insights before you use it for your data analysis.
How to use Power BI Quick Insights?
Before you start using the Power BI Quick Insights, ensure that you have either a Power BI Pro or Premium license as a pre-requisite.
To use the Quick Insights feature in Power BI, follow the instructions outlined below:
Step 1: Log into the Power BI Service portal i.e. https://app.powerbi.com/.
Step 2: Navigate to My workspace from the left navigation menu.

Step 3: Click on the Type to segregate the various objects such as Dataflow, Dashboard, etc.
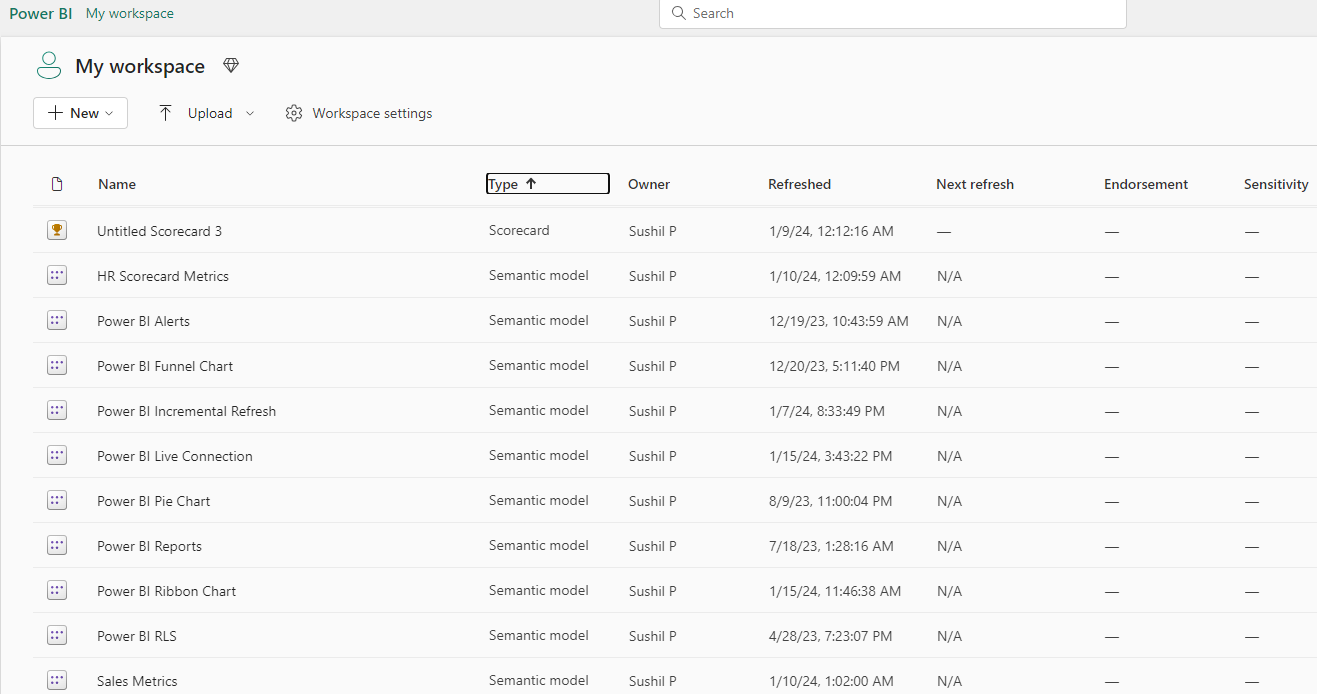
Step 4: Hover your mouse over any semantic model name. This will display a few icons against the Name. Select More options (…) next to the semantic model name.

Step 5: Select the Get quick insights option from the context menu.

Power BI will use statistical algorithms to generate insights for the semantic model you have selected.

Once the insights are generated, you will see a confirmation message along with a link to view the insight page.

Step 6: Click on the View insights button. Power BI will navigate you to the Quick Insights for the semantic model you have selected.

Step 7: Click on the Focus mode icon. It will open the insight in a full page.

You can use Pin visual or get insights. The Get insights feature will generate additional insights for the chosen insight as shown below.

Exit Focus mode to return to the Quick Insight screen.
Step 8: Click on the Pin visual option.

It will open up a window providing an option to pin the visual.

Step 9: Select either a new or existing dashboard to pin the visual to dashboard and click on Pin. This will pin the visual to the dashboard you have selected.

You can view the pinned visual on the dashboard.

Power BI Quick Insight format can vary depending on your semantic model. This includes Insight cards, dashboard tiles, QR codes, etc. The level of granularity and complexity for the quick insights format depends on the dataset.
Examples
In this section, we will go through a few examples of using Power BI Quick Insights in Power BI Service.
Example #1
In this example, we will show the use of Power BI Quick Insights using an existing semantic model in Power BI, i.e., the Power BI Pie Chart. The Power BI Pie Chart semantic model contains a table containing information on credit card transactions.
To use the Power BI Quick Insights, follow the instructions below:
Step 1: Log into the Power BI Service portal and navigate to My workspace.
Step 2: Hover your mouse over the Power BI Pie Chart and click on More options (…).

Step 3: Select Get quick insights from the context menu.

Power BI will use statistical algorithms to generate the insights.

Once the insights are generated, you will see a confirmation message box along with the link to the insight i.e. View insights.

Step 4: Click on the View insights button. This will take you to the Quick Insights for Power BI Pie Chart showing different insight cards.
For our semantic model, Power BI has generated 8 insight types which include Count of Exp Type, Index and Count of City, Count of Card Type, Index and Count of City, Count of Card Type, Index, Count of City, etc.


Step 5: Click on the Focus mode icon of an insight card.

This will open the index insight visual.

Step 6: Click on More options (…). You can Generate QR Code or Export data in CSV format. You can apply a filter to your visual.

Step 7: Click on the Get Insights option. This will generate different insights for the chosen insight card.

Example #2
In this example, we will demo another example of using Power BI Quick Insights using HR Scoreboard Metrics. HR Scorecard Metrics semantic model comprises scorecard metrics of various HR goals in an organization.
To use the Quick Insights, follow the instructions below:
Step 1: Navigate to the My workspace in Power BI Service. Hover your mouse over an existing semantic model HR Scorecard Metrics and click on More options (…).

Step 2: Choose Get quick insights from the context menu for the HR Scorecard Metrics.

This will process the generation of quick insights in Power BI.

As you can see, a message that Power BI quick insights not available is provided to the user.

Power BI quick insights not available message can be due to multiple reasons that include a simple data model, lack of enough data, or absence of any date or numeric column in your dataset.
Example #3
In this example, we will create quick insights using the Power BI Ribbon Chart semantic model in Power BI. The Power BI Ribbon Chart semantic model contains multiple datasets such as sales performance, vending machine sales, and eCommerce data.
To use the Power BI Quick Insights, follow the instructions outlined below:
Step 1: Click on More options (…) against the Power BI Ribbon Chart semantic model in My workspace.

Step 2: Select Get quick insights option from the menu.

Power BI will process the generation of Quick insights.
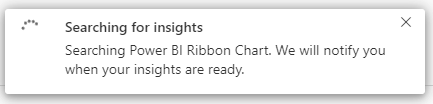
Once the insights are generated, you can view insights by clicking on the View insights link.

Based on your underlying semantic model, Power BI will generate various insight cards.


Important Things to Note
- Power BI Quick Insights works only for the datasets uploaded to Power BI i.e. import mode. It doesn’t support DirectQuery, streaming, and PUSH datasets.
- Quick Insights doesn’t support Row-level security (RLS).
- Quick insights are dependent on semantic models for producing automated visuals. Ensure that the data quality is maintained for accurate insights.
- Power BI deploys advanced machine learning and statistical models to generate Quick insights. Hence it’s critical to make correct business interpretations of those insights in your functional context for effective decision making.
- You can’t apply any customization to the visualizations generated by Power BI Quick Insights
- It is recommended that you use a mix of data types which may include name, time, dates, and numbers
- If your semantic model is simple or does not have enough data or any date or numeric columns, Power BI Quick Insights may throw error messages
Frequently Asked Questions (FAQs)
Power BI Quick Insights can perform various analyses that include:
Power BI Service doesn’t provide any customization options for the visualizations generated by Power BI Quick Insights. While you can’t customize these insights, you can, however, pin those visuals to your dashboard and use Focus mode to zoom in on these visuals for a better understanding of the data points and apply data filters for your analysis.
– You can only use the Power BI quick insights feature for the datasets uploaded to Power BI.
– Quick insights functionality is not supported with other datasets such as DirectQuery, streaming, and PUSH datasets.
– It doesn’t support Row-level security (RLS) including the import mode.
– You can’t apply any customization to the visualizations generated by Power BI Quick Insights.
– Power BI Quick Insights is not supported in Power BI Desktop.
There are multiple ways to share the Power BI Quick Insights results with others. These include:
You can pin the visual to your dashboard and share it with others.
You can use the focus mode available for each insight to navigate to the individual insights and either generate a QR code or export the visual in CSV file format.