
What Is Excel ROWS Function?
The ROWS function in Excel is an inbuilt Lookup & Reference function that determines the number of rows in a specified reference or array.
Users can use the ROWS() to update serial numbers in a set of cells. And when used with other inbuilt functions, the ROWS() can help determine aspects such as the smallest and largest values in the cell range specified.
Use this ROWS Function In Excel Template to follow along with the examples in this article.
Download Excel TemplateFor example, the table below lists students and their Mathematics test scores.

If the requirement is to calculate the total number of rows of students in the given dataset and display the output in cell B18. Then, we can use the ROWS() in the target cell to achieve the desired outcome.

The ROWS() accepts the data range B2:B16 as input. It then counts the total rows in the data range specified and returns the total number of rows of student data as 15.
Key Takeaways
- The ROWS function in Excel helps calculate the total count of rows in a given cell range.
- Users can use the ROWS() as a standalone function to evaluate and display serial numbers in a set of cells. Also, using the ROWS function with other inbuilt Excel functions such as LARGE, SMALL, ROW,and MIN yields practical outcomes.
- We can access the ROWS function from the Formulas tab. Otherwise, we can type the function into the target cell to obtain the required output.
- The ROWS function accepts one mandatory argument, array, as input and returns a number value as the output.
How To Use ROWS Function In Excel?
The syntax of the ROWS function in Excel is,

where,
- array: It is a mandatory argument, which can be an array or a reference to a cell or range. The argument can also be an array formula in excel.
We can apply the ROWS function in Excel cell using two methods:
- Using the Excel Ribbon.
- Manually Entering the Function in the Worksheet.
Method #1 – Using the Excel Ribbon
Step 1: First, click on a target cell.
Step 2: Next, choose the Formulas tab.
Step 3: Then, click the Lookup & Reference function group drop-down button.
Step 4: Now, choose the ROWS function.

Step 5: The Function Arguments window opens. Enter the argument value in the Array field and click OK.

Method #2 – Manually Entering the Function in the Worksheet
- Choose a target cell for displaying the output.
- Type the function name as =ROWS( in the target cell. [Alternatively, enter =R or =RO and double-click the ROWS function from the Excel options.]
- Enter the argument value as the reference to a cell or array and close the brackets.
- Press Enter to execute the function and get the required output.
Basic Example
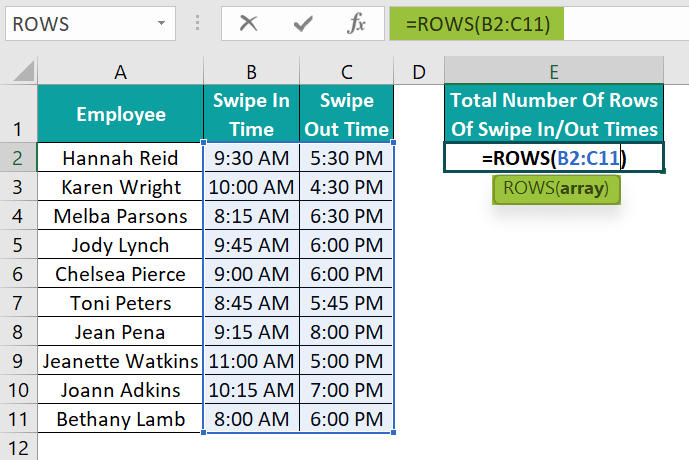
The table below lists a firm’s employees and their swipe in/out times.

If the requirement is to determine the total number of rows of swipe in/out times and display the output in cell E3. Then, we can use the ROWS() in the target cell to fetch the required detail.
- Choose the target cell E3 and enter the ROWS().
=ROWS(B2:C11)
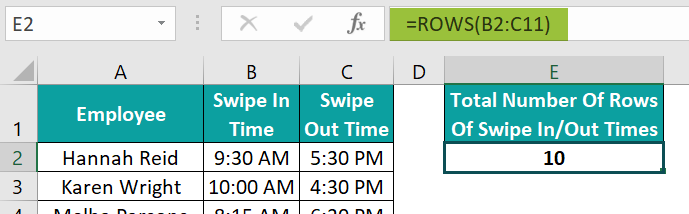
- Press Enter to view the total number of rows of swipe in/out times in cell E3, 10.
[Alternatively, choose the target cell E3 and go to Formulas → ROWS to enter the function in the chosen cell.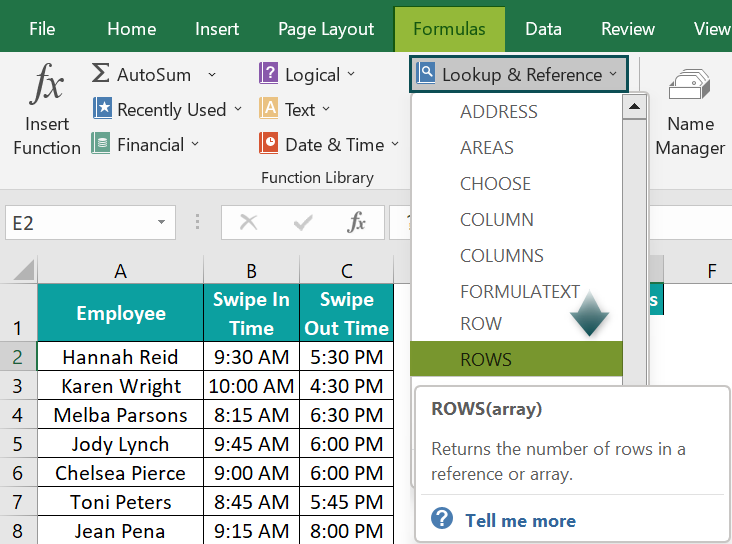
The above step will open the Function Arguments window.
Next, enter the concerned cell range reference in the field provided in the Function Arguments window.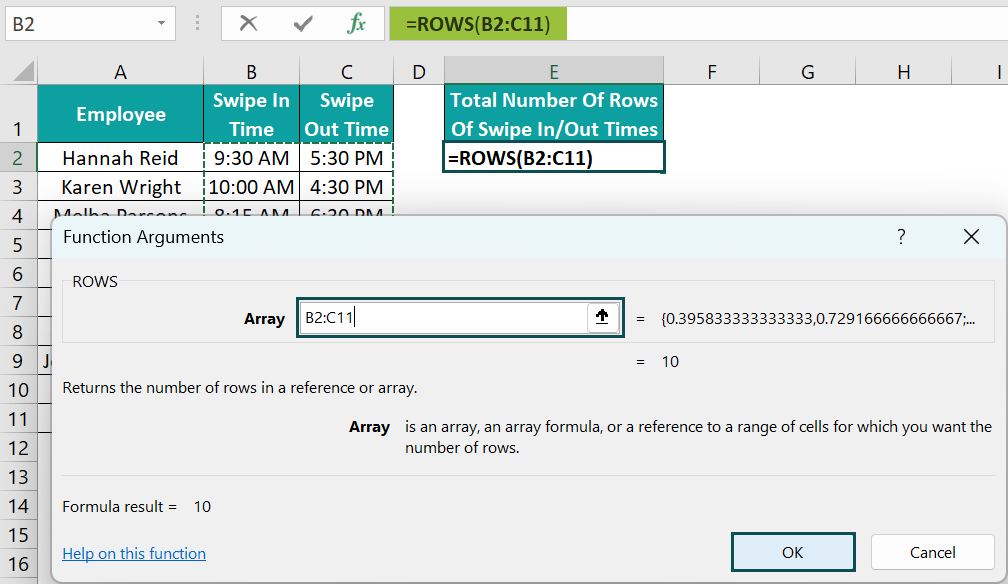
Finally, clicking OK will close the window. And we will see the ROWS() output in the target cell E3.]
The ROWS() accepts the cell range B2:C11, containing the employees’ swipe-in and out timings. And it counts and returns the total number of rows in the data range specified, which is 10.
Examples
Check out the following ROWS function in Excel examples to understand its practical usage.
Example #1 – Using Row Cell Reference
The table below shows the top companies on the US market listing and their stock prices.

And the requirement is to determine the total count of rows of companies in the listing and show the output in cell B8.
Then, the method to apply the ROWS() using the row cell reference in the target cell to obtain the required data is as follows:
- Step 1: Click the target cell B8, enter the following ROWS(), and press Enter.
=ROWS(A2:A6)

Alternatively, we can ignore the column name and mention the row numbers as a range while supplying the argument value to the ROWS(). And then, press Enter to achieve the required result.
=ROWS(2:6)

Example #2 – Using Column Cells Reference
The first table in the image below lists US states and their capitals.

And the requirement is to update the total number of rows of US states and capitals in cells D6:D7 in the second table.
Then, the process to apply the ROWS() using column cells reference in the target cells to achieve the required outcome is as follows:
- Step 1: Go to the target cell B4, select it, enter the following ROWS(), and press Enter.
=ROWS(B1:I1)

- Step 2: Choose the target cell B5, enter the following ROWS(), and press Enter.
=ROWS(B2:I2)

The ROWS() in cell B4 accepts the data range B1:I1, containing the US state names. And, as the specified data range contains eight cells but in one row, the ROWS() returns the total count of rows in the cell range specified as 1.
Likewise, the ROWS() in cell B5 accepts the data range B2:I2, containing the US state capitals. And, as the specified data range contains eight cells but in one row, the ROWS() returns the total count of rows in the cell range specified as 1.
Example #3 – Count of Rows
The table below lists paper types in the available colors.

And the requirement is to determine the total number of rows of paper types in the given dataset and display the output in cell E1.
Then, the procedure to apply the ROWS() using the count of rows in the target cell to achieve the required data is as follows:
- Step 1: Go to the target cell E1 and select it, enter the ROWS(), and press Enter.
=ROWS(A2:B8)

The ROWS() accepts the data range A2:B8 as the input and counts the total rows in the cell range specified. And since the given cell range contains seven rows, the ROWS() returns the value of 7 as the output.
Alternatively, we can supply the array of rows containing the paper types as the argument value to the ROWS(), as shown below, to achieve the required outcome.

The ROWS() accepts the array of row numbers as the input. It counts the total array elements and returns the required output, 7.
Otherwise, we can supply the data range values as an array to the ROWS(), as shown below, and achieve the required result.
=ROWS({“A1″,”Red”;”A4″,”Pink”;”A3″,”Blue”;”A5″,”Green”;”A2″,”Orange”;”A3″, “White”;”A6″,”Black”})

The ROWS() accepts the 7×2 array containing the given dataset values as the input. So, it returns the required number of rows as 7.
Example #4 – Insert Serial Numbers
The table below lists the latest tech products, their brands and price details.

And the requirement is to update the products’ serial numbers in cell range A2:A11 using the ROWS(). Then, the steps will be as explained below:
- Step 1: Click the target cell A2, enter the following ROWS(), and press Enter.
=ROWS($A$2:A2)

- Step 2: Using the fill handle, enter the formula in cells in the range A3:A11.

The ROWS() accepts the cell range such that the first cell reference is absolute. It ensures the first cell in the cell range supplied as input to the ROWS() in all the target cells remains the same.
And the reference to the last cell in the cell range provided is relative, as it must change according to the respective target cells.
Next, the function in each target cell determines the total rows in the cell range specified to return the count as the output.
For instance, the cell range supplied as the argument value to the ROWS() in cell A11 is $A$2:A11. And hence, the ROWS() returns the total count of rows in the range mentioned in the function argument as 10.
Difference Between ROW & ROWS
The difference between the ROW and ROWS function in Excel is as follows:
- The ROW excel function accepts a cell reference and returns the referenced cell’s row number. But the ROWS() accepts an array or reference to a cell or range and returns the total number of rows in the range specified.
- While we can enter the ROW() without an argument value in a cell, we must supply an argument value to the ROWS() to use it in a cell.
- Comparing the ROW and ROWS function in Excel shows that the ROW() is useful when we require the specified cell’s row number instead of the value the cell contains. But the ROWS() is useful when we require the count of rows in the cell range specified instead of the values they contain.
Important Things To Note
- The argument value supplied to the ROWS function in Excel should be proper. Otherwise, the function output will be the #NAME? error.
- The ROWS() will not work if you try applying it in a cell without the argument value.
- The ROWS() will not work if the supplied argument value is not an array or a reference to a cell or range.
- Use the ROWS() when the requirement is to determine the total count of rows in a data range. And use the ROW() if the requirement is to determine the row number of the specified cell.
Frequently Asked Questions (FAQs)
The use of ROWS function in Excel is that it helps display serial numbers in a set of cells.
Furthermore, we can use the ROWS() with other inbuilt Excel functions, such as MIN, LARGE, and SMALL. It helps when the requirement is to determine the last row number, the highest and lowest values in the dataset specified.
The ROWS function in Excel is not working, perhaps because of the following reasons:
• The supplied argument value is not a cell reference, array, or range.
• The supplied argument value is invalid.
• The applied ROWS() is empty.
The difference between ROWS function in Excel and COLUMNS function in Excel is that the ROWS() calculates the total count of rows in the cell range provided as the argument.
On the other hand, the COLUMNS() determines the total number of columns in the cell range provided as the function argument.
For example, the first table in the image below shows a list of fruits and their order data.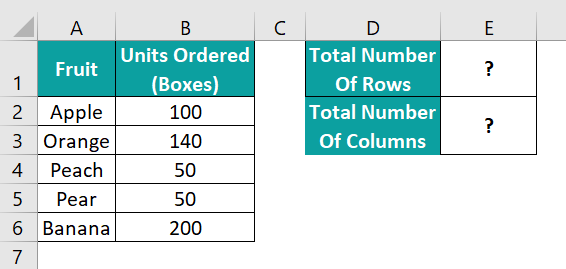
If the requirement is to determine the total number of rows and columns in the above dataset and display the two values in cells in the range E1:E2 in the second table. Then, we can use the ROWS() and COLUMNS() in the target cells as explained below:
• Step 1: Choose the target cell E1, enter the following ROWS(), and press Enter.
=ROWS(A2:B6)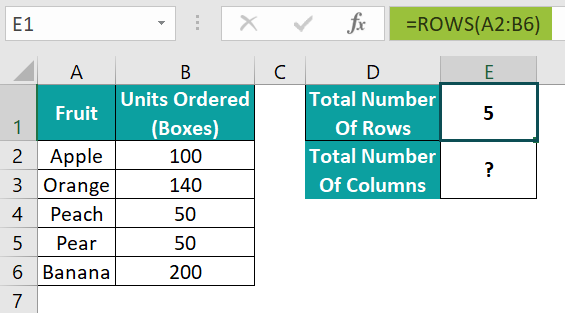
• Step 2: Click the target cell E2, enter the following COLUMNS(), and press Enter.
=COLUMNS(A2:B6)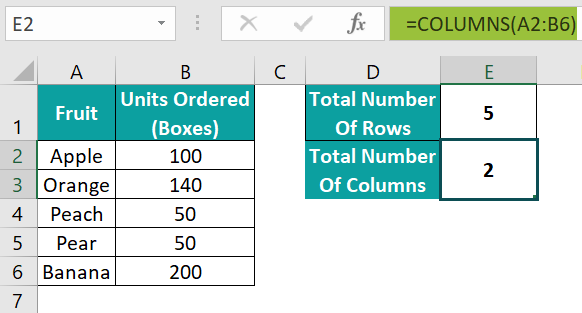
The ROWS() in cell E1 accepts the given data range A2:B6 and counts the total rows in the given cell range. And since the cell range contains five rows, the ROWS() returns the value of 5 as the output.
The COLUMNS() in cell E2 accepts the given data range A2:B6 and counts the total columns in the given cell range. And since the cell range contains two columns, the COLUMNS() returns the value of 2 as the output.
Use this ROWS Function In Excel Template to follow along with the examples in this article.
Download Excel TemplateRecommended Articles
Continue with these related resources when you want the next practical step in this topic.
- Cell References in Excel
- Relative References in Excel
- Mixed References In Excel
- 3D Reference in Excel
- Structured References In Excel
Explore the full Excel Reference Functions guide or browse Excel Resources.