
What is SUMXMY2 in Google Sheets?
SUMXMY2 in Google Sheets is a statistical function used to find the sum of the squares of the differences between two sets of numbers. In other words, it measures how much one set of values differs from another by squaring each difference and then adding them all together. This function is especially valuable when you want to compare actual versus predicted values, or to analyze the accuracy of forecasts or models.
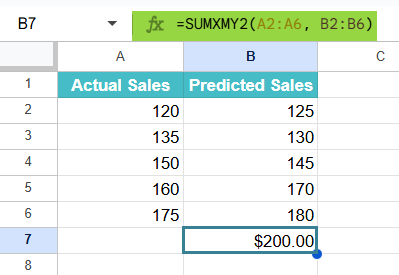
Let us look at an example. Suppose you have two sets of sales data from a company. One is the actual sales in cells A2:A6 and the other is their predicted sales in B2:B6. To find how much they differ overall, let us use the following formula:
Use this SUMXMY2 in Google Sheets Template to follow along with the examples in this article.
Download Excel Template=SUMXMY2(A2:A6, B2:B6)
The function calculates the result as $200, which represents the total squared difference between the two sets of numbers.
Key Takeaways
- SUMXMY2 in Google Sheets calculates the sum of the squares of the differences between two arrays or ranges of numbers.
- The syntax of the function is as follows: =SUMXMY2(array_x, array_y).
- It is widely used in data analysis, model evaluation, and error measurement to quantify how much two datasets differ.
- Both data ranges must have the same number of numeric values, and Google Sheets will ignore empty or text cells.
- The result is always a non-negative number, representing the total squared difference between corresponding values.
Syntax
The syntax of the SUMXMY2 function in Google Sheets is:
=SUMXMY2(array_x, array_y)
The arguments are:
- array_x – The first range or array of numbers (for example, actual values).
- array_y – The second range or array of numbers (for example, predicted or target values).
Notes:
- Both ranges must contain the same number of data points.
- The function subtracts each value in array_y from its corresponding value in array_x, squares each difference, and adds them all together.
- The result is always a positive number, due to the squaring.
How to Use SUMXMY2 Function in Google Sheets
Once you understand what the SUMXMY2 function does, the next step is to learn how to apply it correctly in your spreadsheet. The function is quite simple to use — you just need to select two equal-sized ranges of data that you want to compare.
You can enter the SUMXMY2 function manually as a formula or insert it directly using the Google Sheets menu. Let’s go through both methods step-by-step.
Entering SUMXMY2 Manually
Here, we are comparing actual scores with predicted scores of a student in a few tests to find out how much they differ overall using the SUMXMY2 function. Let’s say you have the following dataset:
Step 1: Enter the required details in a sheet as shown below.

Step 2:Type the function starting with the equals sign:
=SUMXMY2(
- Now, select the first range of values (actual scores).
- Click and drag to highlight A2:A6, or simply type it.
- Next, select the second range of values (predicted scores).
Your complete formula becomes:
=SUMXMY2(A2:A6, B2:B6)
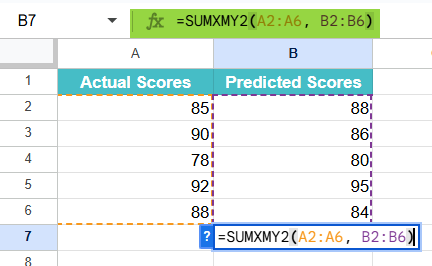
Step 3: Press Enter. The result will appear in the selected cell as 54, which means the total of the squared differences between the actual and predicted scores is 54.

This helps you see how much variation or error exists between the two datasets.
Using SUMXMY2 From the Google Sheets Menu
If you wish to enter the formula through the built-in function menu, follow these simple steps:
- Select the cell where you want the result to appear.
- Go to the Insert menu on the toolbar.
- Go to Function → then go to Statistical.
- From the list, select SUMXMY2.
- Enter the arguments. Press Enter.
Google Sheets will now display the total sum of squared differences between the two datasets.
Examples
Analysts use SUMXMY2 in data analysis to measure how much two sets of values differ. This function is handy in error analysis, forecasting, and statistical modeling, as it helps quantify total variation between corresponding data points. Let’s look at a few practical examples.
Example #1 – Measure the Difference Between Two Data Sets
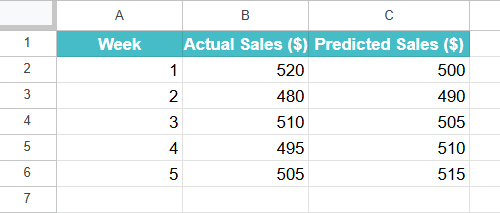
A small business owner wants to evaluate how close their predicted weekly sales were to the actual weekly sales. By calculating the sum of the squared differences, they can identify how much total variation exists between forecasted and real figures. This helps in improving the accuracy of future predictions.
Step 1: Enter the following data in a Google Sheet:
Step 2: Click on a blank cell and type the formula:
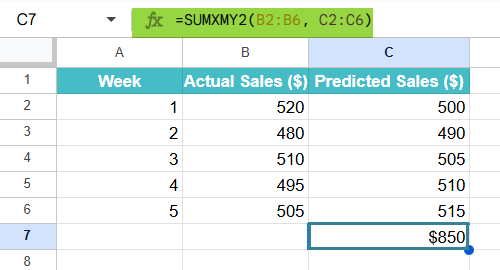
=SUMXMY2(B2:B6, C2:C6)

Step 3:Press Enter. The result will be 650. This means the total of the squared differences between the actual and predicted weekly sales is 650 units².
This analysis shows how much overall variation there was between predicted and actual results. A lower SUMXMY2 value would indicate that the predictions were quite accurate, while a higher value signals greater forecasting error.
Example #2 – Calculate the Sum of Squared Differences for Regression Models
A data analyst is building a regression model to predict the number of website visitors. After running the model, they want to measure how far the predicted visitor counts deviate from the actual visitor counts. SUMXMY2 can help calculate the sum of squared errors (SSE) — a key metric in evaluating model accuracy.
Step 1:Enter the data below into a Google Sheet:
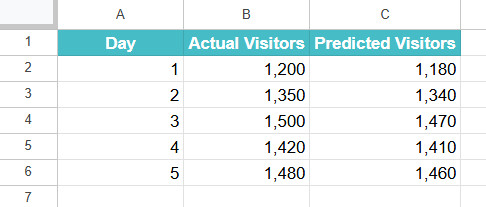
Step 2:Select an empty cell where you want the result to appear and enter the following formula:
=SUMXMY2(B2:B6, C2:C6)

Step 3: Press Enter. The result indicates that the total squared difference (or total prediction error) between the actual and predicted visitor counts is 1,400.
The SUMXMY2 value helps the analyst understand how well the regression model fits the data. A smaller result means the model’s predictions are very close to the actual outcomes, whereas a larger result shows more error and the need for model refinement.

Example #3 – Evaluate the Magnitude of Error in Experimental Data
A researcher is testing a new measuring instrument and wants to compare its readings with standard reference measurements. By using the SUMXMY2 function, they can quantify how much the instrument’s readings deviate overall from the true reference values.
Step 1: Enter the experimental data as follows:

Step 2: Click on an empty cell and enter the formula shown below.
=SUMXMY2(B2:B6, C2:C6)

Step 3: Press Enter. The result will be 0.23. This means the total squared deviation between the instrument readings and the reference values is 0.23, which is relatively small.
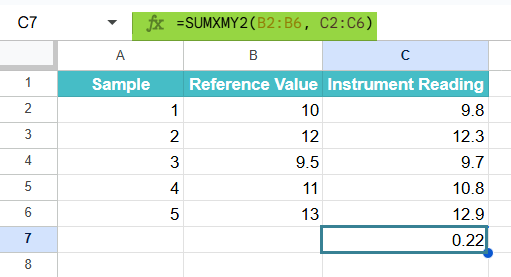
The low SUMXMY2 value indicates that the instrument’s readings are very close to the reference standards, suggesting high accuracy. If the result were larger, it would point to possible calibration errors or measurement inconsistencies that need correction.
The SUMXMY2 function is a simple yet powerful tool for comparing two datasets in Google Sheets. Whether you are evaluating prediction accuracy, analyzing experimental precision, or checking consistency in results, this function helps you quantify the total squared difference and make data-driven improvements confidently.
Important Things to Note
- Ensure that both ranges or arrays used in the SUMXMY2 formula contain the same number of numeric data points; otherwise, Google Sheets will return an error.
- Text or blank cells within the selected ranges are ignored, but any invalid or mismatched data entries can cause incorrect results.
- If the data involves measurements, make sure both arrays are expressed in the same units (e.g., both in dollars, meters, or kilograms) to maintain consistency and meaning in the result.
- SUMXMY2 always returns a non-negative number, since it calculates the sum of squared differences.
- This function is commonly used in statistical modeling, regression analysis, and data comparison to measure the total difference between predicted and actual values.
- You can combine SUMXMY2 with other functions like SQRT (to find the root mean square difference) or AVERAGE (to find mean squared deviation) for deeper data insights.
Frequently Asked Questions (FAQs)
Some of the most common errors include:
#N/A Error – This occurs when the two arrays or ranges are not of equal length. Each element in the first range must have a corresponding element in the second range.
#VALUE! Error – You’ll get this if one or both ranges contain non-numeric values (like text or symbols) that Google Sheets cannot interpret as numbers.
Incorrect range selection – If headers, labels, or mixed data types are accidentally included, the function may produce unexpected results.
We use SUMXMY2 when we need to calculate the total squared difference between two related datasets.
It is especially helpful in:
1. Regression analysis, to measure the total prediction error (Sum of Squared Errors).
2. Forecasting, to compare actual vs. predicted outcomes.
3. Experimental analysis, to evaluate measurement accuracy between observed and reference values.
In short, use SUMXMY2 whenever you want to quantify the total deviation between two sets of numbers.
1. SUMXMY2 computes the sum of squared differences between two arrays
2. SUMX2MY2 calculates the difference between the sums of squares
3. SUMSQ adds up the squares of individual numbers in a single array
So, SUMXMY2 is the best choice when you want to find how far two datasets differ from each other overall.
Use this SUMXMY2 in Google Sheets Template to follow along with the examples in this article.
Download Excel Template