
What is Tableau drill down?
Tableau drill down refers to the capability of exploring the data granularity by deep diving into more details of a certain data point progressively. It allows an understanding of the specific details of visualization by navigating from a high-level summary to the specific granular data points to analyze the different data insights at each level. For example, you may have created a visualization displaying the cost breakup of different units in an organization and you want to understand which unit is contributing to the most of the cost and the underlying reason for that. You can drill down the visualization to pinpoint the specific unit and then the individual components in that unit contributing to high cost. Tableau doesn’t have any built-in feature to apply drill down, however, you can perform so using different workarounds.
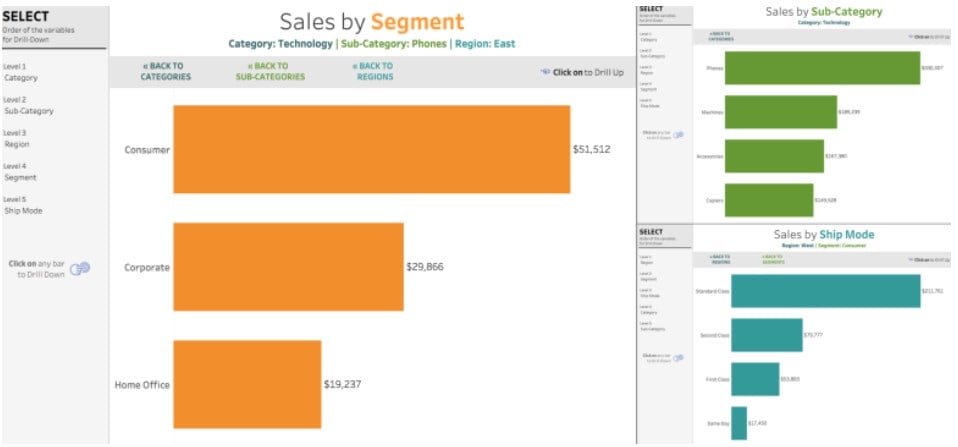
A sample Tableau drill down looks like the one provided below where you can see the drill-down of Sales by Category – Sub-Category – Segment, etc.
Key Takeaways
- Tableau drill down allows you to explore the data granularity by deep diving into more details of a certain data point progressively.
- It allows you to navigate from a high-level summary to the specific granular data points to analyze the different data insights at each level.
- Tableau allows you to apply drill-down either by creating a Tableau drill-down hierarchy or setting up Actions.
- You can apply Tableau drill downs to different visualizations such as maps, Pivot Tables, Bar charts, and Pie charts.
- You can drill down across multiple levels and combine them with other Tableau features.
- You can drill down both numerical and categorical fields in Tableau.
How to drill down in Tableau?
You can perform drill down in Tableau using the hierarchies or actions.
To drill down in Tableau using actions, follow the instructions outlined below:
Step 1: Import your data source into Tableau public.
Step 2: Create a visualization in a Tableau worksheet. You can create a map, pivot table, bar chart, or any other visualization in the worksheet using the imported dataset. For example, you can create a Pie chart with a breakdown of an investment portfolio of a user across different asset classes i.e. Fixed Income, Equities, Commodities, Real Estate, etc.
Step 3: Create another visualization in a new worksheet. This visualization shall include the drill-down data details of the previous visualization. For example, in this visualization, you can further break down each asset class where you can show the split across the Fixed Income i.e. bonds, deposits, treasury bills, etc. A similar breakdown can be extended to equities or commodities such as gold, silver, or other products.
Step 4: Define Actions in the 1st Tableau worksheet to Tableau drill down to another worksheet. You can do so by navigating to Worksheet – Actions. On the Action screen, click on Add Action -> Filter. Specify the details, such as source worksheet, target worksheet, run actions, etc, on the Action Filter screen.
Step 5: Select any of the portions in your first visualization in the Tableau worksheet to drill down to another worksheet. You will notice that Tableau will navigate you to the second visualization with the values filtered as per the specification provided on the Actions page.
You can similarly create hierarchies and apply drill-down, as well as create Tableau drill down reports for your end users.
In the next section, we will look at different examples using which you can apply drill down in Tableau.
Examples
In this section, we have provided different variants or use cases for applying drill-down features in Tableau.
Example #1 – Map Drill-Down
In this example, we created a State Map visualization in Tableau and then applied drill-down logic to display specific details of the measure for the selected state. We demonstrated this example using a Superstore Dataset that contains the sales details across different stores located in different states in the US.
To apply Map drill-down in Tableau, follow the steps outlined below:
Step 1: Import your dataset into the Tableau interface.

Step 2: In a new worksheet, drag State to the Rows shelf and Profit to the Columns shelf. Tableau will create a bar chart as shown below.

Step 3: Click on the Show Me toolbar and select Maps Visual.

Tableau will automatically create a Map visual with color-coding in the Tableau view, as shown below.

Step 4: In a new worksheet, drag State and City to the Rows shelf and Profit to the Columns shelf. Drag Profit to the Color to create a bar visual, as shown below.

Step 5: In the 1st worksheet, i.e., State Map, navigate to the Worksheet – Actions.

Step 6: Go to the Actions screen. Click on Add Action – Filter.

Step 7: In the Filter Action screen, specify the filter name and provide the source and target sheets. Define the run action and click on OK.

Step 8: Tableau will create the Action visible in the Actions screen. Click on OK.

Step 9: On the State Map sheet, click on any of the states in the view. Here, we have selected Colorado.

Tableau will navigate you to the bar chart drill-down sheet displaying the profit breakup across the different cities in Colorado providing a view of which city contributed to maximum negative profits.

Example #2 – Drill-down Pivot Table
In this example, we have demonstrated how you can apply drill down to a pivot table in Tableau using the Dataset Salary 2024 in Tableau. The Dataset Salary 2024 contains details of the industry salary across different levels of data science resources.
To drill down the pivot table, refer to the steps below:
Step 1: Connect to the Dataset Salary 2024 into Tableau public.

Step 2: Create a parameter in a new worksheet. This is in the Tableau.

Step 3: In the Parameter screen, provide the name and specify the properties. Click on OK.

Step 4: Create an Input Parameter by following the step above by specifying the choices below.

Step 5: Create calculated fields by choosing the option from the context menu.

Here we have created multiple calculated fields by specifying the logic in the calculated field editor as shown below:
Dimension Level – This field was created to provide users with options for Tableau drill down levels.

Input Field – This field determines the input parameter and is accordingly used in the Tableau drill down dashboard to define the actions.

Input Filter – This field will exclude the ones users don’t wish to drill down.

Previous Level Display – This will display the previously selected drill-down options to the users using a bracket (∟).

Level Down Field – This field instructs the Drill Down level parameter to go down to a level when users click on the visual to drill down.

Step 6: Now, create a pivot table by following the tasks below.
- Drag the Previous Level Display and Dimension Level to the Rows shelf
- Drag Salary in USD to the Columns shelf
- Drag the Input field to the Details.
- Drag Input Filter to the Filters and then tick the True checkbox.

Step 7: Drag the Level Down Field to the Detail. Right-click on the field and choose Discrete.

Step 8: Right-click on the Level Down Field and select Dimension.

Step 9: Right-click on the parameters and show Parameters.

Tableau will display the parameters along with the visual in the view.

Step 10: Create a new dashboard and drag the Pivot table sheet to the view. Adjust the view as per below.

Step 11: Click on Dashboard – Actions.

Step 12: In the Actions window, Click on Add Action – Change Parameter.

Step 13: In the Add Parameter Action, specify the choices as shown below.

Step 14: Similarly, add another action by choosing Add Action – Change Parameter.

Step 15: In the Add Parameter Action, specify the name, Target Parameter, and Source field.

You can view all the defined actions in the Actions screen. Click on OK.

Step 16: Now click on the fields in the view to perform the drill down as shown below.

Step 17: In a new worksheet, create multiple calculated fields by specifying the logic in the calculation editor screen. These include:
Level up Field – This will ensure that if the user is away from the first level, then they can go back one level up.

Prev Level Input – This calculation will ensure that Tableau understands what to show when users go a level up.

Level Up Label

Step 18: Create the level-up button by adding MIN(1.0) to the Columns shelf.

Tableau will display the view, as seen below.

Step 19: Change the Marks type to Shape. Drag the Level Up Label to the Shape and Detail.

Step 20: Drag Prev Level Input to the Detail. Also drag Level Up Field to the Detail.

Step 21: Apply customization to the view.

Step 22: Create a calculated field [Drill down level] – 1 by adding it via a filter.

Step 23: Drag the field to the Pages pane.

Step 24: Right-click on the axis and choose Edit Axis.

Step 25: In the Edit Axis, specify the choices as per below.

Step 26: Right-click on the axis and uncheck the Show Header option.

Step 27: Apply customization to the view.

Step 28: Drag the Level Up Calc sheet to the view.

Step 29: Click on Dashboard – Action. In the Actions page, click on Change Parameter.

Step 30: In the Create Parameter Action, specify the logic for the action as per below.

Step 31: Similarly, add parameter action for the Tableau drill down level-up action as highlighted below.

All the Tableau actions can be viewed on the Actions screen.

Step 32: Now, on the Tableau drill down dashboard view, click on the column values to perform drill-down. As you can see, Tableau has applied a drill-down to navigate to the Job Type level.

Step 33: Click on the Go to Employment Type button to drill up. You can continue doing so to drill up to the Experience Level.

Example #3 – Drill Down Bar Chart
In this example, we will display a working example of drilling down a bar in Tableau using the Data Worldwide Coffee Habits dataset. The Worldwide Coffee Habits contains a detailed look into coffee consumption patterns across various countries, providing valuable insights into how coffee is enjoyed around the world.
To drill down a bar chart in Tableau, follow the instructions outlined below:
Step 1: Connect to the Worldwide Coffee Habits dataset.

Step 2: Drag Year and Coffee Consumption fields to the Tableau view.

Step 3: Change the Year to Discrete.

Step 4: Drag and drop Year to Filters pane.

Step 5: Specify the year range between 2015 and 2023 in the Filter screen.

Step 6: Change the view to Entire View. In the Tableau view, you will see a bar chart.

Step 7: Drag Year to the Color to create a visualization as per below.

Step 8: Click on Color – Edit Colors. Specify the Color Palette for the visual.

Tableau will update the visual using the chosen color palette.

Step 9: In a new worksheet, create another visual by dragging the fields to the view. This visual is the breakdown of coffee consumption across different types of coffee varieties.

Step 10: Change Year to Discrete.

Tableau will create a bar chart with a breakdown of different coffee varieties across the years.

Step 11: Apply the Year filter in the Filter pane.

Step 12: Apply color-coding to the visual by dragging the Type of Coffee to the Color.

Step 13: Go to the previous worksheet. Select Worksheet – Actions.

Step 14: In the Filter Action screen, specify the source and target sheets. Click OK.

Step 15: Click on OK on the Actions screen.

Step 16: Click on a bar chart, say 2019.

Tableau will navigate you to the coffee consumption for different types of coffee and a year sheet showing the breakdown across different coffee variants.

Important Things to Note
- For Tableau drill down hierarchy, ensure that the levels are accurately defined for a seamless drill-down experience.
- For actions, be clear about specifying the source and target sheets for an accurate drill down.
- Drill down may have performance implications that need to be considered, especially for large datasets.
- Ensure that you have performed testing for accurate Tableau drill down results.
- It is recommended that you clearly define the level-down and level-up navigations for a smooth drill-down experience for the end users.
Frequently Asked Questions (FAQs)
Yes, you can drill down across multiple levels in Tableau. You can do so either by using the hierarchies or by setting actions to apply drill-downs across multiple levels.
Yes, you can apply to drill down in Tableau Server and Tableau Online.
Yes, absolutely. You can combine drill-down actions with other Tableau features such as Filters and parameters. Please refer to the examples section for the same.
In Tableau, you can drill down on both numerical and categorical data. For example, you can drill down on total profits across different regions to determine the state/city that contributes the most to the total profits.