
What Is Weibull Distribution In Excel?
The Weibull distribution in Excel is a continuous probability distribution used to analyze model failure times and product reliability. Excel offers an inbuilt Statistical function, WEIBULL.DIST, which determines the Weibull distribution based on the specified inputs.
Users can use the WEIBULL.DIST() for performing intangible asset valuation, such as credit card default rates, in the finance domain.
Use this Weibull Distribution In Excel Template to follow along with the examples in this article.
Download Excel TemplateFor example, the table below contains the inputs to generate Weibull distribution in Excel.

Assume the target cell is B7.
Then, we can use the WEIBULL.DIST() to generate Weibull distribution in Excel cell B7 for the specified parameters, as shown below.

In the above example, the specified function form is TRUE. So, the WEIBULL.DIST() output is the Weibull cumulative distribution function for the terms above 0.8920937.
Key Takeaways
- The function for Weibull distribution in Excel, WEIBULL.DIST() determines a continuous probability distribution based on the input parameters.
- Users can use the WEIBULL.DIST() when reviewing a device’s failure times and performing reliability analysis. And you can utilize it while conducting intangible asset valuations such as stock brokerage accounts.
- As input, the WEIBULL.DIST() accepts four mandatory arguments, x, alpha, beta, and cumulative.
- Suppose we supply the alpha, beta, and cumulative argument values. Then, you can plot the Weibull distribution for different values of x using the WEIBULL.DIST() and Scatter chart type.
Weibull Distribution() Excel Formula
The function for Weibull distribution in Excel, WEIBULL.DIST() has the following syntax:

where,
- x: The numeric value at which we require to assess the function.
- alpha: The alpha parameter to the distribution.
- beta: The beta parameter to the distribution.
- cumulative: It determines the function form.
Ensure to supply all the above argument values when using WEIBULL.DIST(). Otherwise, we might face the condition of the Weibull distribution in Excel not working.
How To Use Weibull Distribution Excel Function?
We can use the function for Weibull Distribution in Excel, WEIBULL.DIST(), in 2 ways, namely,
- Access from the Excel ribbon.
- Enter in the worksheet manually.
Method #1 – Access From The Excel Ribbon
First, select a target cell for output. Next, select the Formulas tab and then, click the More Functions option drop-down.
Then, click the Statistical option right arrow and select WEIBULL.DIST function, as shown below.

The Function Arguments window appears. Now, enter the arguments in the X, Alpha, Beta, and Cumulative fields and then, click OK.

Method #2 – Enter In The Worksheet Manually
- To begin with, choose a target cell for the output.
- Next, type =WEIBULL.DIST( in the cell. [Alternatively, type =W or =WEI and double-click the WEIBULL.DIST function from the Excel suggestions.]
- Then, enter the arguments as cell values or references and close the brackets.
- Finally, press Enter to execute and get the required Weibull distribution.
Let us understand Weibull distribution in Excel with example.
The following table contains the WEIBULL.DIST() input argument values.

Suppose the ask is to obtain the Weibull cumulative distribution function in cell C9.
Then, we can apply the WEIBULL.DIST() in the target cell and achieve the value. And the Weibull cumulative distribution function will be for the terms above it.
- To begin with, select the target cell C9 and then, enter the WEIBULL.DIST() in the following way.
=WEIBULL.DIST(D4,D5,D6

Next, enter a comma, and Excel will show the options TRUE and FALSE as a drop-down list to choose the cumulative distribution function or probability density function.
Then, double-click on TRUE, as we require the Weibull cumulative distribution function.
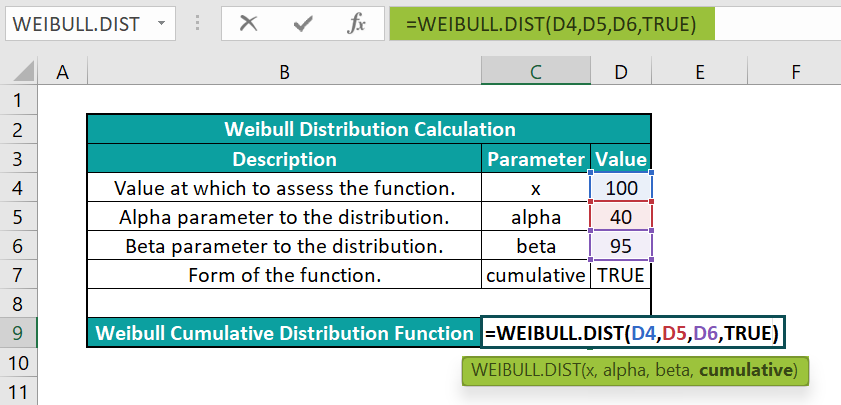
=WEIBULL.DIST(D4,D5,D6,TRUE)
- Next, press Enter to view the output.

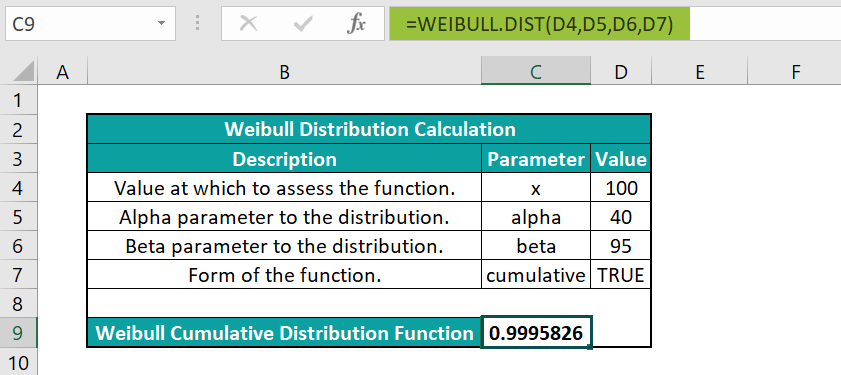
Alternatively, we can enter the below formula to get the same output.
=WEIBULL.DIST(D4,D5,D6,D7)
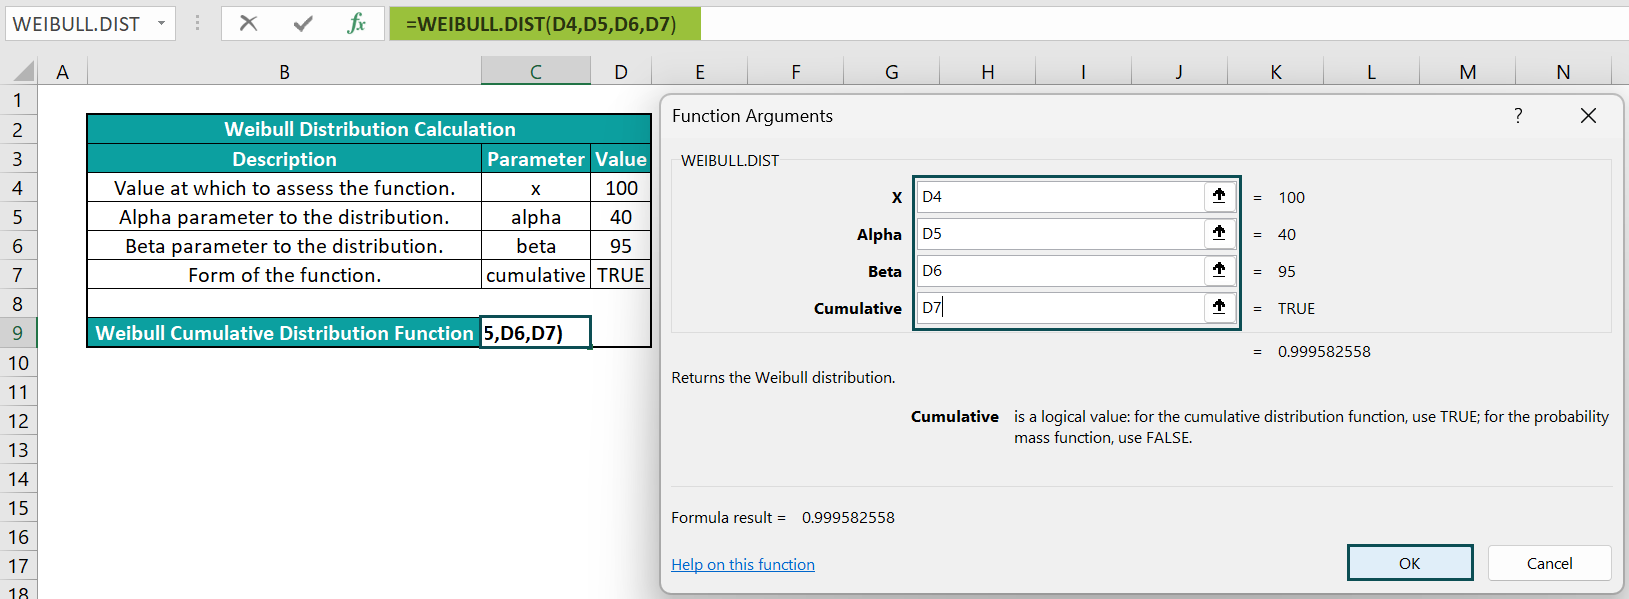
[Meanwhile, we can select the target cell C9 and follow the path Formulas → More Functions → Statistical → WEIBULL.DIST to use the function in the chosen cell.
Now, the Function Arguments window will open, where we need to update all the argument fields to avoid the condition of the Weibull distribution in Excel not working.
Close the window by clicking OK. Now, we will obtain the WEIBULL.DIST() output as 0.9995826.]
So, the WEIBULL.DIST() output is the Weibull cumulative distribution function for the terms above 0.9995826.


Examples
Check out the following Weibull distribution in Excel illustrations to understand the WEIBULL.DIST function’s practical usage.
Example #1
The below table contains the WEIBULL.DIST() inputs to compute the Weibull cumulative distribution function.

Suppose you must perform the required calculations in cell B9. Then, you can apply the WEIBULL.DIST() in the target cell and achieve the required output.
- Step 1: First, select the target cell B9, enter the WEIBULL.DIST(), and then, press Enter.
=WEIBULL.DIST(C4,C5,C6,C7)

Thus, the WEIBULL.DIST() output is the Weibull cumulative distribution function for the terms above 0.9432565.
Example #2
In the previous section, we saw how to determine the Weibull cumulative distribution function using the function for Weibull distribution in Excel with example.
We shall now see how to calculate the Weibull probability density function.
The below table contains the WEIBULL.DIST() inputs to compute the Weibull probability density function.

Suppose we must perform the required calculations in cell B9. Then, we can apply the WEIBULL.DIST() in the target cell and achieve the required output.
Step 1: To start with, select the target cell B9, enter the WEIBULL.DIST(), and then, press Enter.
=WEIBULL.DIST(C4,C5,C6,C7)

The cumulative argument value is FALSE as we require the Weibull probability density function.
And the result is the Weibull probability density function for the terms above 0.0304645.
Example #3
We shall see how to use the WEIBULL.DIST() for plotting Weibull distribution in Excel.
The first table contains the alpha and beta values.

Suppose the requirement is to use the given WEIBULL.DIST() inputs and determine the Weibull cumulative distribution function for various values of x, given in cell range A8:A23. And then plot the Weibull cumulative distribution function.
Then, the steps are as follows:
- Step 1: First, select cell B8, enter WEIBULL.DIST(), and press Enter.
=WEIBULL.DIST(A8,$C$2,$C$3,$C$4)

- Step 2: Next, using the excel fill handle, enter the above formula in cell range B9:B23.

The WEIBULL.DIST() accepts the values in the first table as the last three arguments. And it determines the Weibull cumulative distribution function for each value of x given in cells A8:A23.
- Step 3: Then, click on a cell in table range A7:B23 and select the chart using the path Insert → Scatter → Scatter with Smooth Lines.

- Step 4: Now, click the chart area to enable the Chart Elements option, the ‘+’ icon.

- Step 5: Next, click the ‘+’ icon and check the Axis Titles box.

And once we update the axes titles using the respective elements in the chart area, we will obtain the below Weibull cumulative distribution function plot.

Likewise, plotting Weibull distribution in Excel is possible for the Weibull probability density function.
We will update the cumulative argument as FALSE in the first table and the second column heading as Weibull Probability Density Function in the second table, as shown below:

Next, update the Weibull probability density function in cell range B8:B23 for the given x values using the formulas in the Formula Bar.


The WEIBULL.DIST() accepts the values in the first table as the last three arguments. And it determines the Weibull probability density function for each value of x given in cell range A8:A23.
Finally, create the Weibull probability density function plot, as explained earlier.

Important Things To Note
- The arguments supplied to the function for Weibull distribution in Excel, WEIBULL.DIST() should be numeric. Otherwise, the function will return the #VALUE! error.
- Suppose x is below 0, or alpha or beta arguments are less than or equal to 0. Then, the WEIBULL.DIST() output is the #NUM! error.
- Also, ensure the cumulative argument value is TRUE for obtaining the Weibull cumulative distribution function. And supply the cumulative argument value of FALSE for getting the Weibull probability density function.
Frequently Asked Questions (FAQs)
The WEIBULL.DIST() function in Excel is in the Formulas tab. First, we need to select the target cell and navigate the path Formulas → More Functions → Statistical → WEIBULL.DIST to apply the function in the chosen cell.
The equations for the Weibull cumulative distribution function and the Weibull probability density function are as follows:
Weibull Cumulative Distribution Function![]()
Weibull Probability Density Function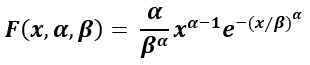
The arguments x, α, and β have the same definition as the WEIBULL.DIST() arguments, explained in the Weibull Distribution() Excel Formula section of the above article.
We can apply the WEIBULL.DIST() in Excel VBA using the below method:
Application.WorksheetFunction.Weibull_Dist(Arg1, Arg2, Arg3, Arg4)
The arguments in the above method have the same definition as the WEIBULL.DIST() arguments, explained in the Weibull Distribution() Excel Formula section of the above article.
Here is an illustration to show how to use the above method.
The first table contains the WEIBULL.DIST() inputs to determine the Weibull distribution.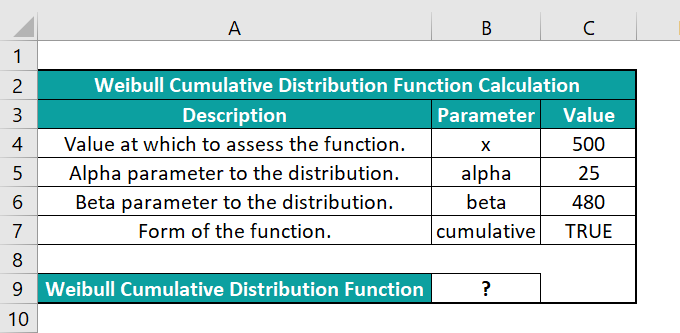
Assume the target cell is B9. Now, let us learn how to apply the WEIBULL.DIST method in Excel VBA to obtain the required data in the target cell.
• Step 1: Keeping the active worksheet containing the above data open, first, access the VBA Editor using Alt + F11 shortcuts.
• Step 2: Next, choose the required VBAProject. and then, click on Module under the Insert tab.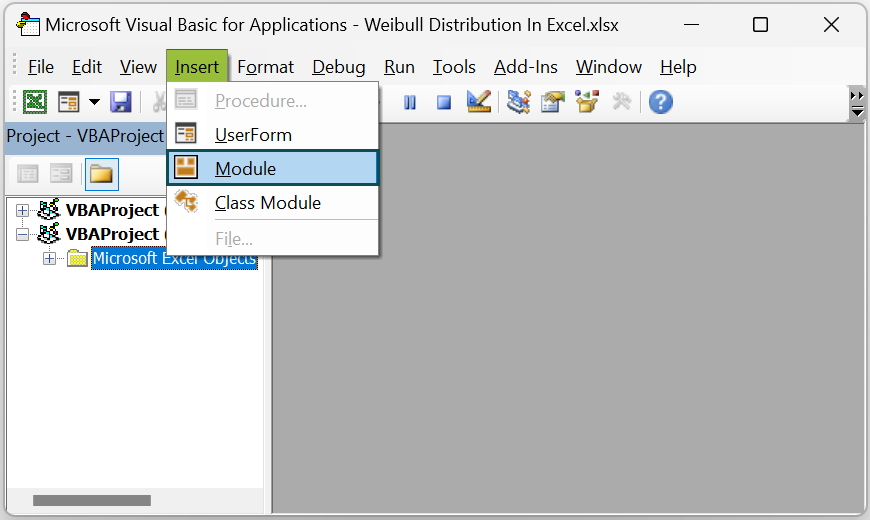
A new Module window opens.
• Step 3: Then, enter the VBA code to apply the WEIBULL.DIST() in the target cell.
Sub Weibull_Dist()
Dim ws As Worksheet
Set ws = Worksheets(“WD_FAQ”)
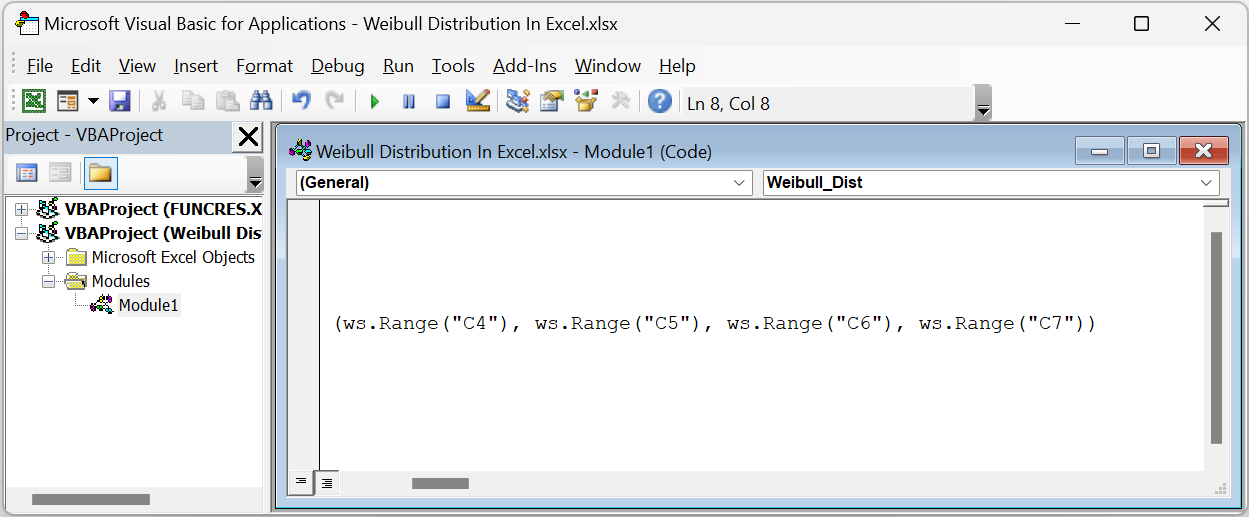
ws. Range(“B9”) = Application.WorksheetFunction.Weibull_Dist(ws.Range(“C4”), ws.Range(“C5”), ws.Range(“C6”), ws.Range(“C7”))
End Sub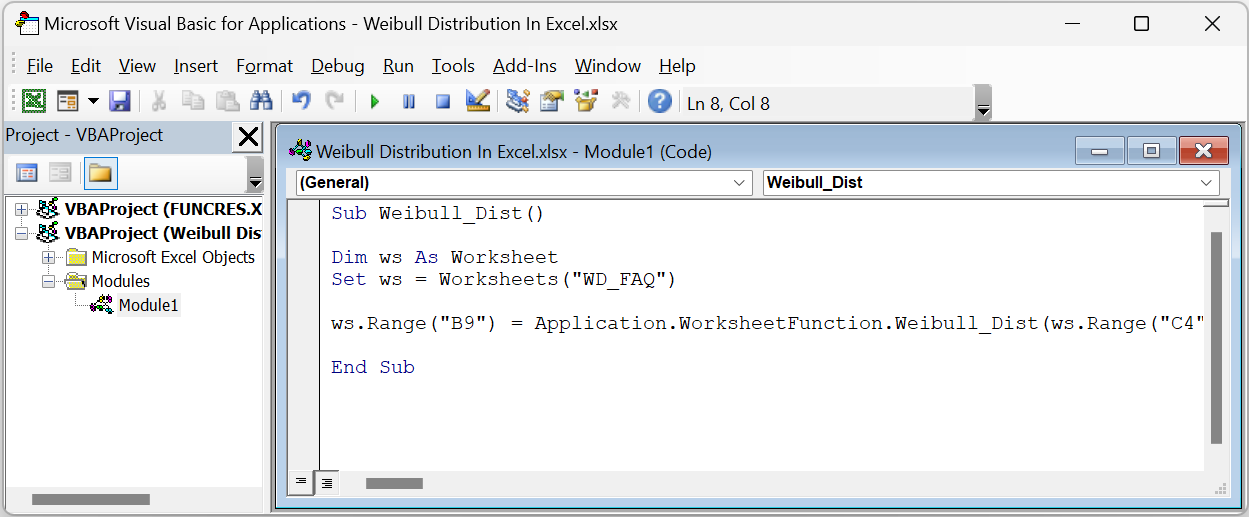
• Step 4: Next, click the Run Sub/UserForm icon to execute the VBA code.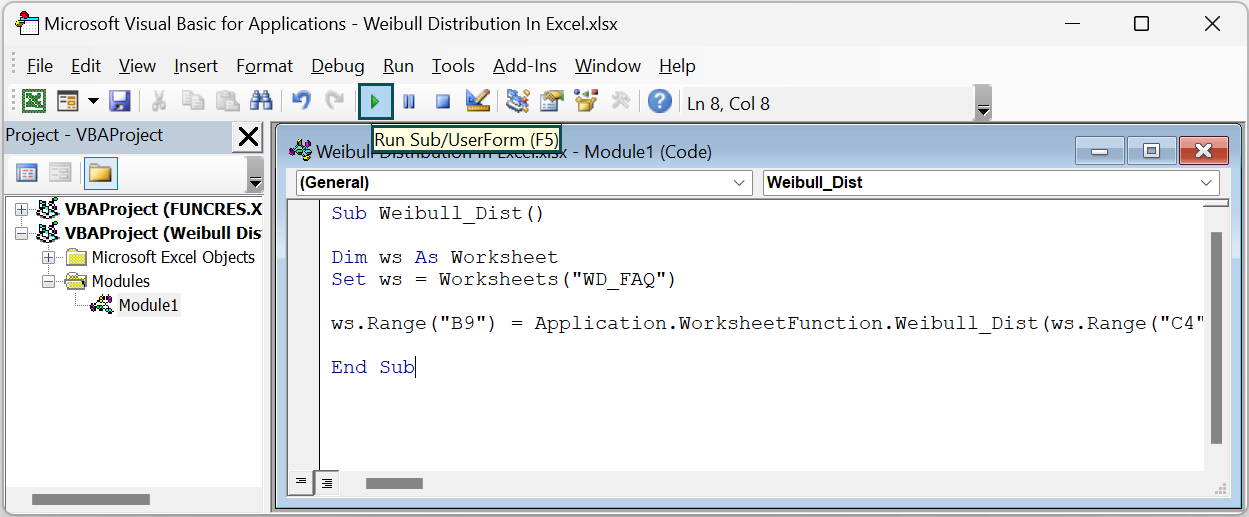
Finally, open the current worksheet to view the output in cell B9.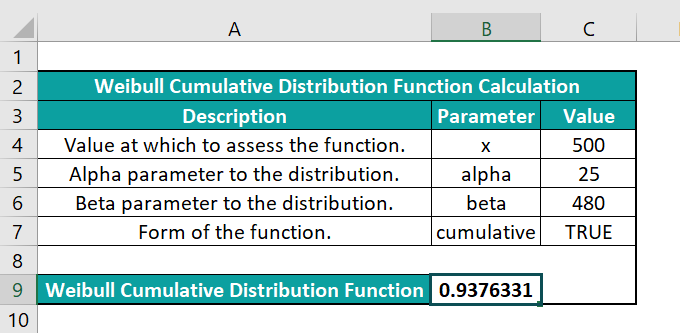
The WEIBULL.DIST method accepts the cell references to the values x, alpha, beta, and cumulative. And as the argument cumulative is TRUE, the method returns the Weibull cumulative distribution function for the terms above 0.9376331.
We can ensure the WEIBULL.DIST() in Excel does not return an error by adhering to the following aspects:
• The arguments supplied to the WEIBULL.DIST() as input are numeric values.
• The argument x is not less than 0, or alpha or beta arguments are not less than or equal to 0.
Use this Weibull Distribution In Excel Template to follow along with the examples in this article.
Download Excel TemplateRecommended Articles
Continue with these related resources when you want the next practical step in this topic.
- Statistics In Excel
- Descriptive Statistics in Excel
- Standard Deviation In Excel
- MEDIAN Excel Function
- MODE Excel Function
Explore the full Excel Statistical Functions guide or browse Excel Resources.