
What Is A Covariance Matrix in Google Sheets?
We use covariance in statistics as a measure of how changes in one variable are linked to changes in a second variable. In other words, it is a measure of the extent to which two variables are associated linearly. Therefore, a covariance matrix in Google Sheets is a square table that shows the covariance between multiple variables. One can calculate and quantify how different pairs of variables change together using formulas.
As an example, we have three variables, X,Y, and Z. We write the covariance matrix as follows:
| X | Y | Z | |
|---|---|---|---|
| X | Cov(X,X) | Cov(Y,X) | Cov(Z,X) |
| Y | Cov(X,Y) | Cov(Y,Y) | Cov(Z,Y) |
| Z | Cov(X,Z) | Cov(Y,Z) | Cov(Z,Z) |
Here, the diagonal shows variance (Cov(X,X), Cov(Y,Y), and Cov(Z,Z). The off-diagonal entries show the covariances (e.g., Cov(Y,X)).
Use this Covariance Matrix in Google Sheets Template to follow along with the examples in this article.
Download Excel TemplateKey Takeaways
- A covariance matrix in Google Sheets is a matrix that shows the covariance between multiple variables as a pair. It helps us understand how two variables move together across a dataset.
- There are two types of covariance functions: COVARIANCE.P and COVARIANCE.
- The syntax is as follows: we use either the older COVAR function or the newer versions of this function. We use COVARIANCE.P(range1, range2) for an entire population and COVARIANCE.S(range1, range2) for sample data. Here, range1 and range 2 are the datasets of equal length.
- Check if your variables are organized such that those in the columns align with the corresponding values in rows when building a covariance matrix.
Syntax
The covariance matrix in Google Sheets can use three types of functions. Let us look at what they are and their syntax.
– COVAR
The COVAR function in Google Sheets finds the covariance between two data sets. It assumes that the data represents the entire population.
The syntax of the COVAR function is as follows:
=COVAR(data_y, data_x)
- data_y – the range of values or references that consists of dependent data.
- data_x – the range of values or references that consists of independent data.
COVARIANCE.P
COVARIANCE.P is a variation of the COVAR function. It calculates the population covariance. It measures how two data sets may change together. Covariance is used when the data includes the entire population.
=COVARIANCE.P(data_y, data_x) (similar to COVAR)
Use this when analyzing complete datasets, such as all customer purchases for a year.
COVARIANCE.S
COVARIANCE.S is used to find the sample variance and calculate how two variables may change together in a sample. The difference is that we used it when the dataset is a subset of a larger group. It Can be used for surveys or partial observations.
=COVARIANCE.S(data_y, data_x)
How To Use Covariance Matrix Function in Google Sheets?
Let us look at how to create the covariance matrix in Google Sheets. In this case, we should use the COVAR function. The function calculates the covariance between two sets of data. We will have to apply it across a full range to construct a full covariance matrix. As seen in the introductory section above, we must create a matrix where each cell represents the covariance between two variables. The diagonal shows their variances.
Step 1: Let us input the data into columns. Here, we have the daily stock prices of three companies.

Step 2: Now, go to another area in the sheet and prepare the matrix. Add rows and columns that will represent the variables.
Here, we have three variables (A, B, C). Hence, our output matrix will be a 3×3 matrix.

Step 3: Except the diagonal values, for each cell of the matrix, use the COVAR function to calculate the covariance between the corresponding variables. For instance, to calculate the covariance between variables A and B, we use the function formula =COVAR(B1:B10, A1:A10) in your output matrix cell.
Step 4: Repeat it for all cells apart from the diagonal.

Step 5: When calculating the covariance between a variable and itself, we calculate the variance. Let us use the VAR function on the diagonal to do this. For instance, =VAR(A1:A10) for the variance of variable A.
Step 6: Thus, you have populated all the cells in your covariance matrix. Be sure to use the correct cell ranges for your data.

What do the results of the covariance matrix mean?
- Positive Covariance: If the result is positive, it indicates that as the hours of study increase, the grades tend to increase (they move in the same direction).
- Negative Covariance: If the result is negative, it indicates that as hours of study increase, the grades tend to decrease (they move in opposite directions).
- Zero or Near Zero Covariance: If the covariance is close to zero, it suggests that the two variables have no linear relationship.
Examples
Let us look at some practical examples to understand the use of the COVAR function in Google Sheets.
Example #1
In this covariance matrix example, let us compare the values of temperatures and the statistics of cool beverages sales with some data. It can be done using the COVAR function. The list of steps are present below.
One can do it using the COVAR function. The steps are listed below.
Step 1: Let us enter the details in a Google Sheet. Column A contains the temperature in Celcius and Column B contains the sales of cold beverages.

Step 2: Let us use the COVAR function to calculate the covariance between the two parameters.
=COVAR(B2:B8, A2:A8)
This will give you the covariance of the data, which shows the relationship between the temperature and the sale of ice creams.

If the covariance value is positive, it means that as the temperature increases, cold beverage sales tend to increase; if the covariance value is negative, it suggests that an increase in temperature will lead to a decrease in sales. A covariance value of zero or near zero suggests that there is no linear relationship between the sales and temperature.
Example #2 – COVARIANCE.P
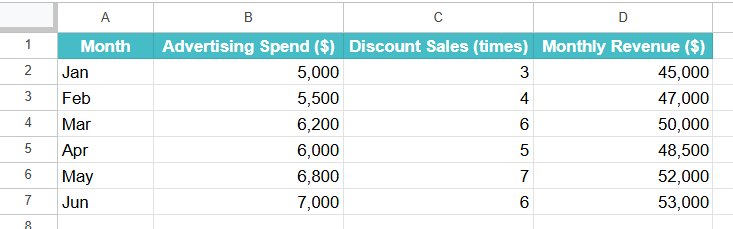
Let us consider a store where they spend a certain amount on advertising and discount sales. Here, we wish to find if there is a relationship between the amount spent on advertising, the discount sales per month, and the monthly revenue over the past six months.
Step 1: Enter the data in a sheet as shown below.
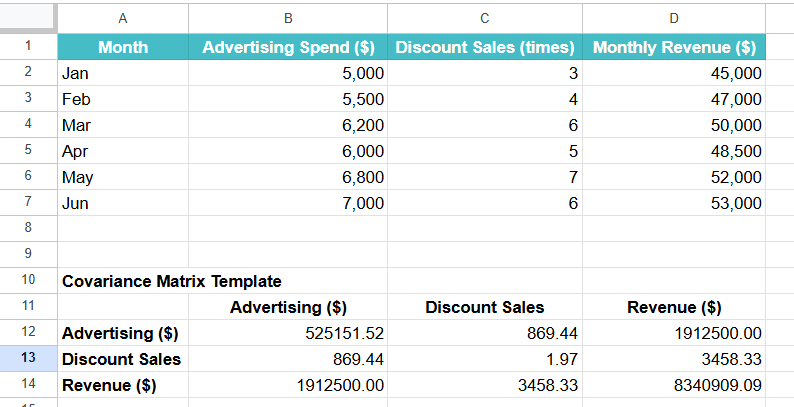
Step 2: Let us calculate the covariance matrix as shown below. For the diagonal values, you can find the variance.
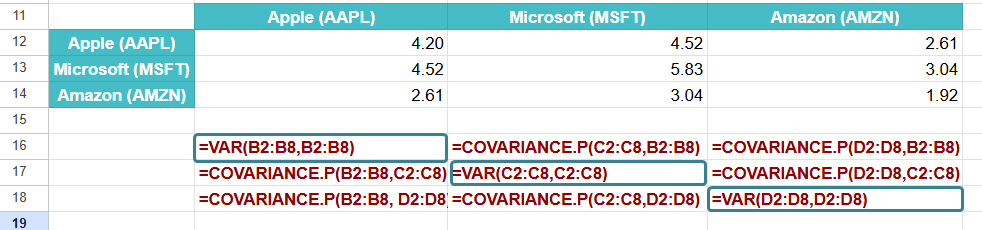
Step 3: You can complete the matrix with the formulas as shown below.

Example #3 – COVARIANCE.S
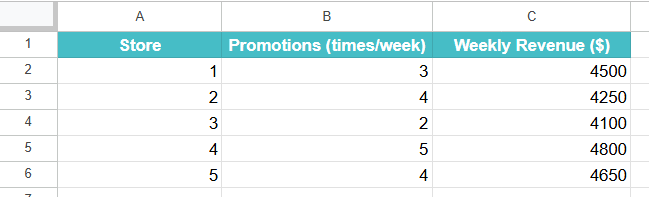
Let us consider an example where an organization conducts a sample survey across five stores. The store chain is distributed throughout the country. We try to understand the relationship between the weekly promotions and the weekly revenue by tabulating them and using the COVARIANCE.S formula since we are taking only a sample of the survey. Look below to find the covariance matrix explained.
Since this is only a sample of stores, we use COVARIANCE.S, which estimates covariance based on a sample.
Step 1: Let us input the table into a sheet.
Step 2: Construct a 2*2 matrix with the two variables as shown below. Enter the covariance formula in all the cells.

Step 3: Press Enter. The result is the sample covariance between promotions and revenue.

In this example, we use COVARIANCE.S because the data comes from a sample of stores and not the entire population of all stores.
Important Things to Note
- We use the COVARIANCE.P function to calculate population covariance. The COVARIANCE.S function is used to calculate sample covariance.
- You can assign names to the data ranges to improve the readability of your formulas as shown below.
=COVARIANCE.P(Stock_A, Stock_B)
- If an array contains values such as empty cells, they are ignored.
- If the two arrays are of different lengths, the COVAR function returns the #N/A error value.
Frequently Asked Questions (FAQs)
A positive number when applying the covariance function indicates that the two variables tend to increase or decrease together, indicating a linear dependency.
A negative number indicates that a change in one variable causes a reverse change in the other; that is, when one variable increases, the other decreases.
A covariance near zero indicates there is not much of a relationship between the two variables.
We can find two types of covariance in Google Sheets, which we calculate with two primary functions. They are COVARIANCE.P and COVARIANCE.S. We use COVARIANCE.P to calculate the population covariance. It means that the function assumes you are using the whole data population. COVARIANCE.S calculates the sample covariance, assuming the data is a sample from a larger population.
We use the covariance matrix to measure the linear relationship between different stocks or financial assets and check how they move together.
We use the covariance in genetics to understand the relationship between different genetic traits.
Its other use is to study the relationships between environmental variables like humidity and rainfall.
Use this Covariance Matrix in Google Sheets Template to follow along with the examples in this article.
Download Excel TemplateRecommended Articles
Continue with these related resources when you want the next practical step in this topic.
- Descriptive Statistics in Google Sheets
- Standard Deviation in Google Sheets
- MEDIAN Google Sheets Function
- MODE Google Sheets Function
- Frequency Distribution In Google Sheets
Explore the full Google Sheets Statistical Functions guide or browse Google Sheets Resources.