


Introduction
Data analysts and finance professionals often avoid building custom DAX measures because the syntax feels intimidating and error‑prone. A simple miscalculation in aggregation or time intelligence can distort KPIs and mislead stakeholders. Natural Language DAX Power BI measures change this by letting users describe what they want in plain language and receive accurate DAX code. AI tools or Copilot‑style assistants can turn requests such as “show revenue by month, compared to the same period last year” into a working measure, drastically lowering the barrier to complex calculations.
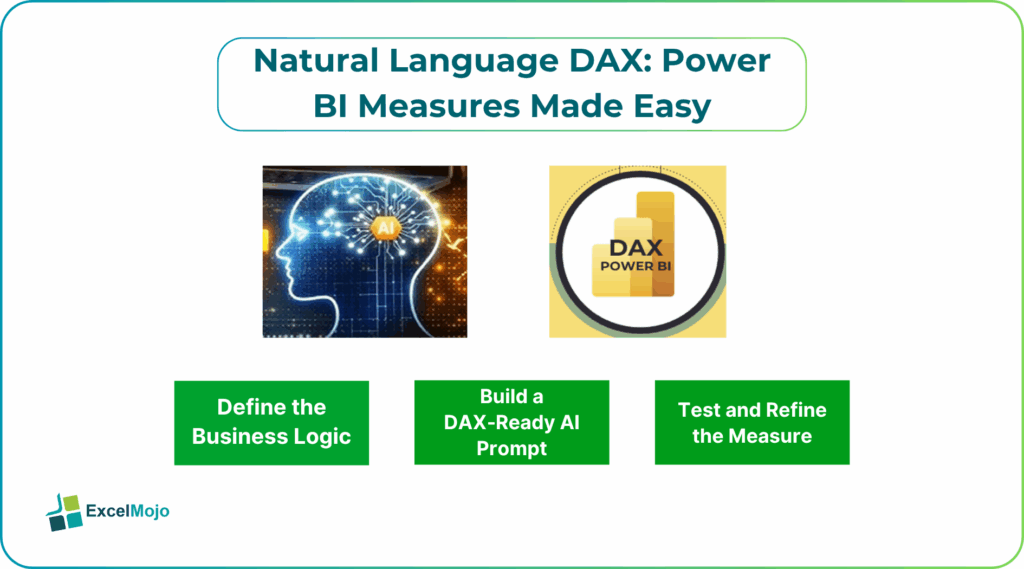
This guide shows how to use Natural Language DAX for Power BI to generate AI assisted DAX measures Power BI that are fast, readable, and aligned with business logic. In this article, we present practical patterns for Power BI measures made easy with DAX, including how to phrase prompts, inspect the generated code, and test measures against known inputs. The approach fits well inside standard Power BI modelling workflows, where data preparation, time‑intelligent calculations, and KPI dashboards intersect.
Why Natural Language DAX Matters in Power BI
DAX governs how Power BI calculates measures such as revenue, margin, and growth. Traditional DAX writing requires understanding context functions like CALCULATE, SUMX, and DATESYTD, plus time‑intelligence helpers like SAMEPERIODLASTYEAR or PARALLELPERIOD. For non‑experts, this steep learning curve often leads to either shallow, fragile models or manual workarounds outside Power BI.
Natural Language DAX for Power BI turns this around by letting users describe the logic in terms of business questions. For example, an analyst can write: “Create a measure that shows revenue by month, compared to the same period last year, and display it as a percentage change.” AI‑based helpers decompose this into:
- The base aggregation (SUM(Revenue[Amount])).
- The time‑intelligence context (SAMEPERIODLASTYEAR).
- The final percent‑change arithmetic.
Recent Power BI training material and AI‑assisted DAX guides emphasize that combining natural‑language prompts with structured DAX knowledge can reduce formula‑writing time significantly for common patterns. For finance teams, that means more time spent on interpreting results than on memorizing DAX syntax.
How to Generate Natural Language DAX Measures
Creating Natural Language DAX measures follows a simple workflow: start with a clear business question, refine the prompt, then import and test the generated DAX into Power BI.
Step 1: Define the Business Logic
Begin by writing the question in plain language, avoiding vague terms. For example, in a sales model with a fact table Sales and a Date dimension, a good starting logic is:
“Show total revenue by month, compared to the same period last year, as a percentage change.”
This logic identifies the metric (Revenue), the grain (by month), and the comparison (same period last year).
Step 2: Build a DAX‑Ready AI Prompt
A strong prompt for AI assisted DAX measures Power BI includes:
- The table and column names.
- The desired output (e.g., a scalar value, a column‑wise measure, or a formatted percentage).
- Any filters or business rules (e.g., excluding cancelled orders or specific regions).
Example prompt:
“Create a DAX measure in Power BI that shows total revenue by month, compared to the same period last year, as a percentage change. Revenue values are in the Sales table in the Amount column. Only include rows where Status = ‘Active’.”
AI typically returns a measure such as:
Revenue YoY % =
VAR CurrentYearRevenue =
CALCULATE(
SUM(Sales[Amount]),
Sales[Status] = “Active”
)
VAR PriorYearRevenue =
CALCULATE(
SUM(Sales[Amount]),
Sales[Status] = “Active”,
SAMEPERIODLASTYEAR(‘Date'[Date])
)
RETURN
IF(
NOT ISBLANK(PriorYearRevenue),
DIVIDE(CurrentYearRevenue – PriorYearRevenue, PriorYearRevenue),
BLANK()
)
This defines a Power BI measure made easy with DAX by encapsulating time‑intelligence and filtering in a single reusable expression.
Step 3: Test and Refine the Measure
In Power BI Desktop, open the model view, add a new measure, and paste the generated DAX. Then:
- Apply the measure to a visual such as a matrix by month.
- Compare the output against a known calculation (e.g., a manual sum for a few months).
- Adjust the logic if needed, such as modifying the Status filter or the date grain.
This cycle keeps Natural Language DAX Power BI measures transparent and testable.
Practical Example: Rolling 12‑Month Revenue
Suppose a finance team wants to show a rolling 12‑month revenue profile instead of fixed calendar‑year numbers. The plain‑language prompt is:
“Create a DAX measure that shows revenue for the last 12 months, rolling forward with each month.”
An AI‑assisted prompt can generate a rolling‑sum measure such as:
Revenue Rolling 12M =
CALCULATE(
SUM(Sales[Amount]),
DATESINPERIOD(
‘Date'[Date],
MAX(‘Date'[Date]),
-12,
MONTH
)
)
This measure becomes a core KPI in dashboards, and analysts can reuse the same pattern for other metrics such as margins or costs.
Pitfalls and Best Practices
Natural Language DAX for Power BI is powerful but introduces common pitfalls.
One risk is over‑complex measures. AI may generate deeply nested CALCULATE expressions with multiple filters that are hard to read and maintain. Analysts should keep measures modular, breaking complex logic into intermediate measures such as Revenue Active, Revenue YoY, and Growth %, then combining them where needed.
Another issue is context misunderstanding. AI may misinterpret business rules or date‑grain assumptions. For example, a measure that appears to compare “same month last year” may actually use the wrong relationship or ignore important dimension filters. To avoid this, users should always test the measure against a small, manually verified dataset and document the logic in a comment or model description.
A third pitfall is performance: poorly structured DAX can slow down reports, especially on large datasets. Best practice is to keep filters explicit, avoid unnecessary EARLIER or recursion where possible, and use summarization tables for heavy aggregations.
Frequently Asked Questions (FAQs)
Yes, beginners can use Natural Language DAX Power BI measures by describing the business question in plain language and relying on AI‑assisted DAX tools. They still need to understand basic concepts such as tables, relationships, and measures, but they do not have to write DAX from scratch.
AI generated DAX measures can be safe for production if the user tests them against known values, checks the context filters, and documents the logic. Blindly accepting AI‑produced DAX without review can introduce subtle errors that affect K‑PIs.
Natural Language DAX speeds up the initial measure creation by turning natural‑language prompts into structured DAX, while manual DAX writing allows more precise control over context and optimization. The two approaches are complementary rather than exclusive.
No, AI assisted DAX measures Power BI should not replace manual DAX optimization. Analysts still need to review performance, simplify calculations, and design efficient models using best practices for data visualization and storage.
Recommended Articles
Continue with these related resources when you want the next practical step in this topic.
- Power BI Dax
- Measures in Power BI
- Power BI Calculate
- Row Context and Filter Context in DAX
- Power BI Calculated Table
Explore the full Power BI Data Modeling and DAX guide or browse Power BI Resources.