What is FORECAST.ETS.SEASONALITY Excel Function?
The FORECAST.ETS.SEASONALITY function is a built-in feature that calculates the duration of a recurring pattern within a specified timeline. This function is primarily utilized in conjunction with FORECAST.ETS, as both functions, employ the same algorithm to identify seasonality. The function is utilized to determine the duration of a season for numerical data, such as sales, inventory, and expenses, that exhibit a recurring pattern.
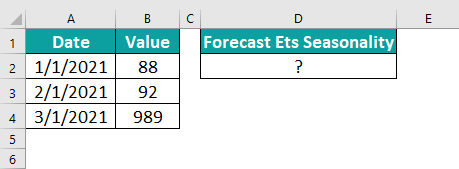
In the following example, we will explore the concept of the FORECAST.ETS.SEASONALITY Excel function to achieve the desired outcome. The table shows three values.

To apply the formula, input it in cell D2, as shown below:
=FORECAST.ETS.SEASONALITY($B$2:$B$4, $A$2:$A$4,1,1)
The resulting value will be displayed.

Syntax

- Values – This is the required argument. It highlights the significance of utilizing a diverse set of historical data to forecast future values.
- Timeline – This is the required argument. It signifies an array comprising either dates or times or independent numeric values, which are arranged sequentially with a uniform interval between each element.
- Data_completion – This is the optional argument. It is used to treat missing data; if 0 is entered, it is considered as missing point 0, and if one is entered, it is considered as the average of the neighboring points.
- Aggregation – This is the optional argument that shows the algorithm of aggregate values of the same timestamp. The default value is 1, which specifies AVERAGE. Other options are as below.
| Aggregation | Aggregation Method |
|---|---|
| 1 | It is for AVERAGE Calculation. |
| 2 | COUNT |
| 3 | COUNTA |
| 4 | MAX |
| 5 | MEDIAN |
| 6 | MIN |
| 7 | SUM |
How To Use FORECAST.ETS.SEASONALITY Function in Excel?
To effectively utilize the FORECAST.ETS.SEASONALITY function in Excel: follow these steps.
#1 – Access from the Excel ribbon
Step 1: Choose the empty cell which will contain the result. Go to the “Formulas” tab and click it.

Step 2: Select the “More Functions” option from the menu.

Step 3: Select the “Statistical” option from the drop-down list. Select “FORECAST.ETS.SEASONALIT” from the drop-down menu.

Step 4: A window called “Function Arguments” appears. As the number of arguments, enter the value in the “value,” “timeline,” “data_completion,” and “aggregation.” Select OK.

#2 – Enter the worksheet manually
Step 1: Select an empty cell for the output. Type “=FORECAST.ETS.SEASONALITY ()” in the selected cell. Alternatively, type “=F” and double-click the FORECAST.ETS.SEASONALITY function from the list of suggestions shown by Excel.

Step 2: Press the “Enter” key to get the result.
Examples
Example #1 – Calculate the length of the seasonal trend
In this example, we will dive into the concept of the FORECAST.ETS.SEASONALITY Excel function and embark on exploring its practical application. We will calculate the length of the seasonal trend of the given values.
The data table showcases the values of the year 2020. We will also calculate the values for the three months of 2021. Prepare the organized table, and let’s calculate the result.

To calculate the output of FORECAST.ETS.SEASONALITY in cell E2, simply follow these steps:
Step 1: To begin, choose the cell where the FORECAST.ETS is calculated. For this example, let’s go with cell C14.
Enter the following values in the formula:
Target date: A14
Values: $B$2:$B$13
Timeline: $A$2:$A$13
=FORECAST.ETS(A14,$B$2:$B$13,$A$2:$A$13)
The result is shown in cells C14 to C16.

Step 2: As the FORECAST.ETS is calculated by entering the formula in cell E2.
Enter the formula exactly as shown below:
=FORECAST.ETS.SEASONALITY($B$2:$B$16,$A$2:$A$16,1,1)

Step 3: As a result, you will see the corresponding value displayed in cell E2, along with the graph, just like in the provided image.

By following these steps, you will be able to calculate the forecast seasonality value using the FORECAST.ETS.SEASONALITY Excel function.
Example #2
We study the concept of the FORECAST.ETS.SEASONALITY Excel function to analyze the monthly sales of 2022 and the three months’ sales of 2023. Our objective is to uncover the seasonal trend within the provided values. Let’s look at the data table below.

To calculate the result of the FORECAST.ETS.SEASONALITY function, we will utilize cell E2.
Step 1: We begin by calculating FORECAST.ETS in cell C14.
Enter the formula as shown below:
=FORECAST.ETS(A14,$B$2:$B$13,$A$2:$A$13)
The result will be displayed in cells C14 to C16.

Step 2: Enter the formula for FORECAST.ETS.SEASONALITY in cell E2, as shown below:
=FORECAST.ETS.SEASONALITY($B$2:$B$16,$A$2:$A$16)

Step 3: The resulting value is displayed, accompanied by a graph similar to the image below.

Example #3
Now, let’s look into some monthly values and use the FORECAST.ETS.SEASONALITY Excel function. The data in the table is organized as follows:

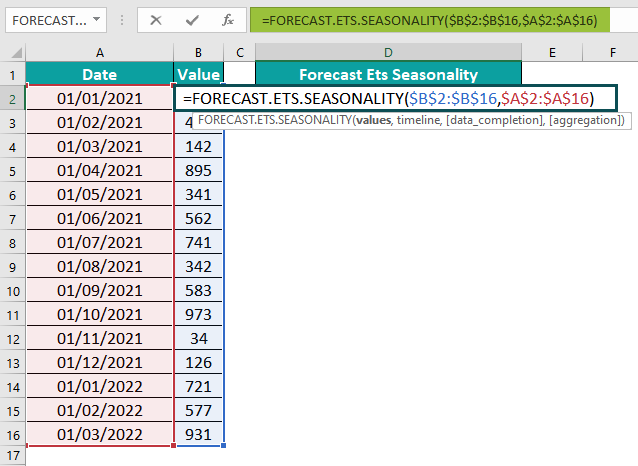
To unlock the FORECAST.ETS.SEASONALITY function and unveil its output in cell D2; follow these steps:
Step 1: First, select the cell D2 to enter the formula. Enter the complete formula as shown below.
=FORECAST.ETS.SEASONALITY($B$2:$B$16,$A$2:$A$16)

Step 2: Press Enter. The desired outcome is achieved in cell D2, accompanied by a graph as shown below.

Important Things To Note
- The FORECAST.ETS.SEASONALITY function offers various optional arguments, allowing users to customize the forecasting process by specifying parameters like confidence levels and prediction intervals.
- The function uses the Exponential Smoothing algorithm, which combines trend and seasonality components to generate accurate predictions.
- The “#VALUE!” error occurs when the parameter “data_completion” and the aggregation parameter is also not a numeric value.
- The #N/A error occurs when the sizes of the values and timeline do not match.
- The #NUM error occurs when the consistent step in the timeline cannot be determined, and all values in the timeline are identical. And the value for data_completion must not be 0 or 1, and the value for aggregation must fall outside the range of 1-7.

Frequently Asked Questions (FAQs)
The FORECAST.ETS.SEASONALITY Excel function analyze time series data and forecasts future values based on seasonal patterns. This function employs the Exponential Smoothing State Space (ETS) algorithm, which takes into account both trend and seasonality components of the data.
Example
The example explains how the FORECAST.ETS.SEASONALITY Excel function works. The table is organized in a specific format.

The Excel FORECAST.ETS.The SEASONALITY Function is not working because there should be no repetitive seasonal pattern detected. If it is done, the output will be zero also if the FORECAST produces the seasonal pattern.ETS.SEASONALITY function mirrors the one computed automatically by the FORECAST.ETS.SEASONALITY function with the seasonality argument set to 1.
The limitations of using the FORECAST.ETS.SEASONALITY function are as follows;
The function uses exponential techniques to forecast future values based on time series data, assuming the pattern based on over time.
If there are any variations in seasonality, the forecasts may be less accurate.
The function requires a minimum of four seasons’ data for reliable results; otherwise, it will generate unreliable forecasts.
When using any forecasting method, it is necessary to remember that unforeseen external factors can significantly impact future outcomes and make all predictions uncertain.
To locate the function, look for an available cell. Proceed to the “Formulas” tab and click on it. From the ensuing menu, choose the “More Functions” option. Within the drop-down menu, select “Statistical.” Then, navigate to the drop-right menu and select “FORECAST.ETS.SEASONALITY.” This action will prompt the appearance of a window titled “Function Arguments.” Within this window, input the appropriate values for the “values,” “timeline,” “data_completion,” and “aggregation” fields, as required by the number of arguments. Finally, select the “OK” button to confirm your selection.
Download Template
This article must help us understand the FORECAST.ETS.SEASONALITY Excel Function’s formula and examples. You can download the template here to use it instantly.
Recommended Articles
Guide to FORECAST.ETS.SEASONALITY function in Excel. Here we learn how to use FORECAST.ETS.SEASONALITY Function in Excel with step by step examples and a downloadable template. You can learn more from the following articles –

Leave a Reply