
What is LOGEST in Google Sheets?
The LOGEST function in Google Sheets calculates the parameters of an exponential curve that is a best fit for a set of data points. It does the exponential regression, which allows you to model data that exhibits exponential growth or decay. The function’s output is an array of values that represent the coefficients of the exponential equation, y = b * m^x.
We use this function to find the exponential curve (y = b * m^x) that best represents the relationship between given data sets (x and y values). The output of the function is an array containing:
- The slope (m) of the exponential curve.
- The y-intercept (b).
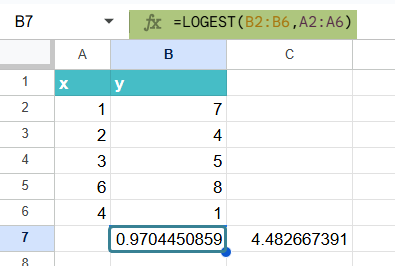
Suppose you have a set of x-values in column A and y-values in column B. We apply the function as follows: =LOGEST(B2:B5, A2:A5). The first value in the result is the base of the exponential function (m), while the second value is the constant multiplier (b).
Use this LOGEST in Google Sheets Template to follow along with the examples in this article.
Download Excel TemplateKey Takeaways
- The LOGEST function fits data to an exponential model of the form y = b × m^x, where m is the growth or decay rate and b is the starting value.
- The syntax of the function is as follows:
- =LOGEST(known_data_y, [known_data_x], [b], [verbose])
- It is commonly used in scientific analysis, forecasting, population studies, financial modeling, and anywhere exponential trends are observed.
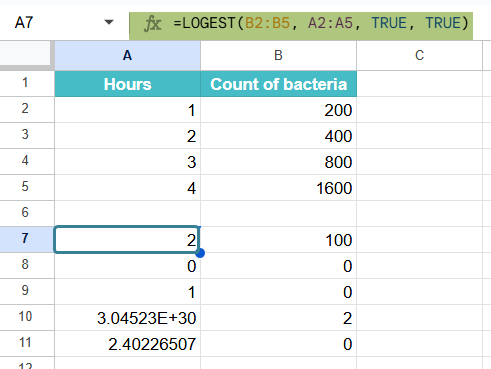
- LOGEST only works with positive y-values—zero or negative values will cause a calculation error.
Syntax
The syntax of LOGEST in Google Sheets is as follows:
=LOGEST(known_data_y, [known_data_x], [b], [verbose])
The arguments represent:
- known_data_y – (Mandatory) The set of y-values you already know from your data.
- known_data_x – (Optional) These are the x-values associated with known_data_y. If omitted, they are assumed to be {1, 2, 3, …}.
- b – (Optional) A logical value indicating whether to force the constant b to equal 1.
- If TRUE, b is calculated normally (default).
- If FALSE, b is set to 1.
- verbose – (Optional) A logical value that determines the detail of the result.
- TRUE: Returns additional regression statistics such as standard errors.
- FALSE: Only returns the coefficients of the curve (m and b) (default).
How to Use LOGEST Function in Google Sheets?
As we know, LOGEST in Google Sheets is used to calculate the exponential trend line that best fits a set of data. It returns values for the exponential curve y = b × m^x, where b is a constant and m is the base of the exponent. We use this function when dealing with data that grows or decays exponentially. Such scenarios include population growth, investments, or bacterial growth.
There are two ways to use LOGEST in Google Sheets:
- Entering LOGEST directly into a cell
- Selecting LOGEST through the menu bar
Entering LOGEST Directly Into a Cell
Let us look at how to enter the function manually.
Step 1: Let us enter the independent (x) and dependent (y) data in separate columns. Here, we enter the x values in Column A and the y values in Column B.

Step 2: Select the cell where you want the first result, that is, the m value, to appear. In case the argument verbose=TRUE, you must select multiple cells to accommodate the additional values. Now, enter the LOGEST formula in Google Sheets as follows:
=LOGEST(B1:B5, A1:A5) – (returns ‘m’ and ‘b’)
With verbose,
=LOGEST(B1:B5, A1:A5, TRUE, TRUE)
It returns an array of values including ‘m’, ‘b’, standard errors, R-squared, and more.
Here, you enter an = sign followed by the formula name and open parentheses. Enter all the arguments separated by a comma and close the parentheses.

Step 3: Press Enter. For older versions of Google Sheets, we may have to enter it as an array formula by pressing Ctrl + Shift + Enter (on Windows).
The output will provide the parameters of the exponential curve y = b * m^x that best fits the provided data. The first value returned is ‘m’ and the second is ‘b’. I
Using the Menu Bar
If you prefer using the menu, follow these steps:
- Go to Insert > Function > All (since LOGEST is not listed under Logical or Math directly).
- From the list, select LOGEST.
- Google Sheets will insert =LOGEST() into the cell.
- Fill in the arguments and press Enter.
Examples
Let us try to understand how the LOGEST function works in practical scenarios. Below, we will explore some real-world examples that show us how LOGEST is particularly useful with data that deals with exponential growth or decay patterns.
Example #1
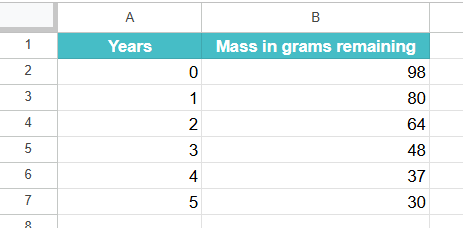
In this example, let us evaluate how a radioactive substance decays over time. This is commonly calculated in physics, where unstable isotopes lose mass at an exponential rate. Here, a scientist is observing the mass of a radioactive sample at regular time intervals. Let us see how he wishes to model this decay using LOGEST in Google Sheets.
By applying exponential regression, we can not only understand how quickly the substance is decaying but also predict how much of it will remain after a certain number of years. This method helps estimate half-lives of isotopes.
Step 1: Enter the data in a sheet as shown below. We have the time in years in Column A and the mass of the radioactive substance in Column B.
Step 2: Let us apply the LOGEST formula as shown below:
=LOGEST(B2:B6, A2:A6, TRUE, TRUE).
It calculates an exponential decay curve that models how the substance loses mass over time.
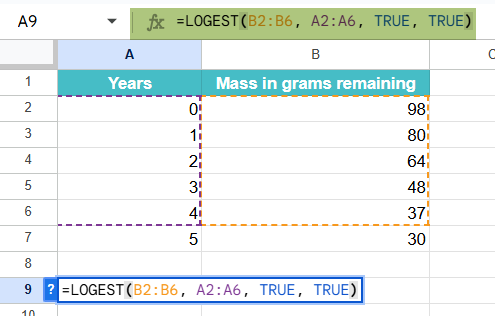
Step 3: Press Enter. As a result, one sees the first value, which represents m (decay factor per year), and the second value, the b (initial mass),

The second row gives the standard errors for both.
Step 4: We can also plot a graph for the same. We will create a scatter plot of x and y to verify that the data follows an exponential curve. Go to
Insert -> Chart. In the pane on the right, choose Scatter Chart.

We can use the model to predict future decay.
Here, we have the first row values as 0.782 and 100.82, which means that the substance retains 78% of its mass each year, and the initial mass is 100.8.
Example #2 – Predict Future Growth Based on Existing Data
Let us look at an example of how an online website’s user base grows over time. It will help the business understand and predict user adoption. The company is tracking its monthly user growth and wishes to forecast the number of users in the future months based on the site’s current growth trends.
We use the LOGEST function to calculate the exponential growth model to project future user counts.
Step 1: Enter the data in a new sheet, as shown below.
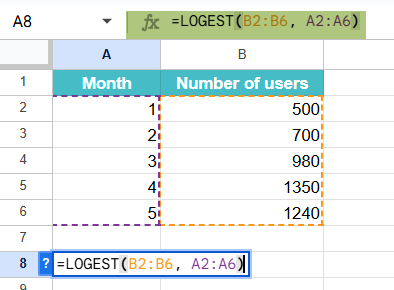
Step 2: Apply the LOGEST formula in an empty cell as shown below.
=LOGEST(B2:B6, A2:A6)
This tells Google Sheets to calculate an exponential curve that best fits the user growth trend over time.
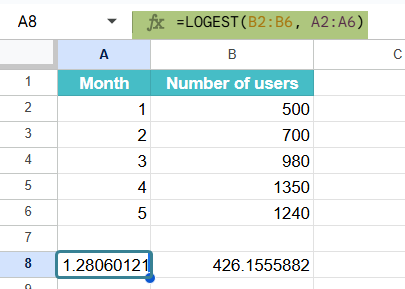
Step 3: Press Enter. The formula will return an array. Here,
The first row shows the growth rate m (1.2) and initial user base b (426).
The second row shows the standard error for each.
Thus, the company can model the exponential growth using the equation:
y = b × m^x
Where:
- x = time (months),
- b = initial users,
- m = growth multiplier per month.
Step 4: Now, plug in values of x for 6,7,8, and use the b and m values to estimate future values.
You can plug values of x (e.g., month 6, 7, 8) into the formula using the b and m values from LOGEST to estimate future users.

Example #3 – Evaluate Investment Returns Based on Exponential Growth Models
In this example, we find the return on a cryptocurrency investment over several months. Cryptocurrency markets sometimes show exponential growth. A person has invested in a cryptocurrency and tracked its value monthly. Now, he must track its historical growth and predict its future price trend. For this, he uses the LOGEST function to analyze how the coin’s value is increasing over time. This is useful for traders and analysts aiming to estimate future prices or determine the point at which an investment might double or triple.
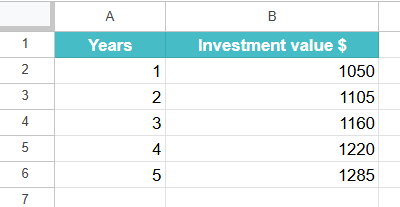
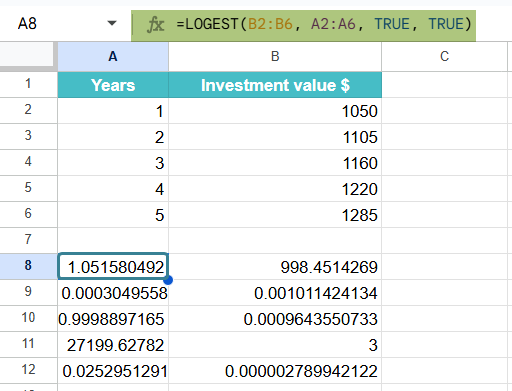
Step 1: Enter all the details in a sheet.
Record the value of the investment at the end of each month. In Column A, enter the month number, and in Column B, input the investment value.
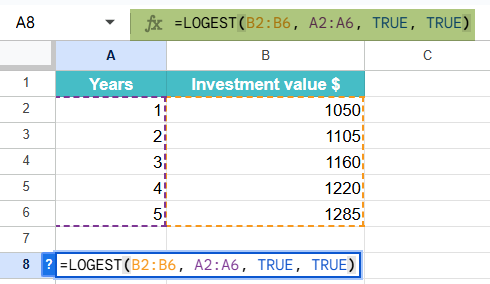
Step 2: Apply the LOGEST formula in Google Sheets as shown below.
=LOGEST(B2:B6, A2:A6, TRUE, TRUE)
The formula shows how the investment grows exponentially over time.
Step 3: Press Enter. We get the following values
- m (growth rate per month) which is 5%
- b (starting value) is estimated to be 998.
This helps the business make informed decisions on scaling and strategic planning. It shows how much profit you’d earn if the trend continues.
Important Things to Note
- LOGEST in Google Sheets fits the data to an exponential curve of the form y = b × m^x and is ideal for modeling growth or decay trends.
- It only works with positive y-values. Any zero or negative numbers in y range will cause errors.
- It is good for forecasting. When we get the m and b values, we can plug in future x-values to estimate the future values.
- The output of the function is an array that includes the growth rate and starting value. Hence, we should allow enough space for the output.
Frequently Asked Questions (FAQs)
If we use the verbose option and set it to TRUE, we get the following results in the second row.
• R^2: The coefficient of determination that indicates how well your model fits the data. A better fit means the value is close to 1.
• Standard error: Gives an idea of the accuracy of the predictions.
We get the following output from the LOGEST formula:
• Slope (m): The coefficient that indicates the rate of exponential growth or decay. In the first row left side.
• Y-intercept (b): The point where the exponential curve intersects the y-axis.
• Regression statistics (if the verbose argument is TRUE): It includes the coefficient of determination (R-squared), which indicates how well the curve fits the data.
1. It is used to forecast exponential trends like sales, population growth, or investment returns etc.
2. It is also used to model exponential decay or growth, such as radioactive decay or bacterial reproduction, with precision.
3. Extract growth rate and initial value to build predictive exponential models.
Use this LOGEST in Google Sheets Template to follow along with the examples in this article.
Download Excel Template