What are the Power BI Date Functions?
The Power BI Date functions enable you to perform different calculations based on date. If you have ever used the date function in Excel or other tools for your calculation purposes, you will find these functions very similar in functionality and usage.
Table of contents
📊 Unlock Advanced DAX Skills in Power BI!
Take your Power BI skills to the next level with our Advanced DAX in Power BI Training Course. Dive deep into advanced DAX functions, complex calculations, and optimization techniques to enhance your data analysis and reporting capabilities.
Top 10 Power BI Date Functions
Here, we have listed the top 10 Power BI Date functions frequently used for reporting requirements. These include:
#1 – DAY
Overview of DAY function:
- DAY function returns the day of a month, i.e., a number value from 1 to 31.
- It accepts the date as the input parameter and provides the return value as Gregorian values regardless of the input value format.
- If the input date value is in text format, this function performs the conversion to an interpretable format using the locale and date/time settings of the client computer.
Now, let’s look at the syntax of the DAY function.
DAY(<Date>)

To create a new measure using the DAY function, follow the steps outlined below:
Step 1: Open the Power BI Desktop. Navigate to the Modeling tab. Click on the New measure.

Step 2: Write a DAX expression using the DAY function to extract the day value for your input date in the formula bar prompt. Click on the Commit icon to save the changes.
DayExample = DAY(TODAY())

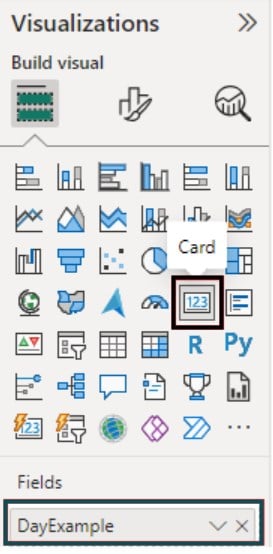
Step 3: Navigate to the Visualizations pane. Select a Card visual icon. Map the newly created measure to the Fields section of the visual.

It will create a card visual in your report canvas in the Power BI.

#2 – MONTH
Overview of MONTH function:
- MONTH function returns the month as a number i.e. 1 (January) to 12 (December).
- It accepts both date and text values.
- For text values, it performs the conversion to an interpretable format using the locale and date/time settings of the client computer. However, if the conversion fails, then error is thrown.
The MONTH function has the below syntax:
MONTH(<Date>)

The steps for using the MONTH function are outlined below:
Step 1: In the Power BI Desktop, navigate to the Modeling – New measure.

Step 2: Write a DAX expression using the MONTH function as shown below.
MonthExample = MONTH(TODAY())

Step 3: Navigate to the Visualizations – Card visual icon. Map the newly created measure to the Fields section of the visual.

It will create a card visual in your report canvas in the Power BI.

#3 – QUARTER
Overview of QUARTER function:
- The QUARTER function returns a number from 1 (January – March) to 4 (October – December).
- It accepts both date and text values as a parameter.
- For text values, conversion to an interpretable format is performed using the locale and date/time settings of the client computer.
- For BLANK input value, it returns a BLANK value.
The syntax of the QUARTER function:
QUARTER(<Date>)

To use the QUARTER function in Power BI, follow the steps outlined below:
Step 1: Create a new measure similar to example – 2 by writing a DAX expression using the QUARTER function.
QuarterExample = QUARTER(TODAY() – 30)

Step 2: Navigate to the Visualizations pane – Card visual icon. Drag and drop the newly created measure to the Fields section of the visual.

It will create a card visual in your report canvas in the Power BI.

#4 – YEAR
Overview of YEAR function:
- YEAR function returns the year of a date, i.e., a 4-digit value in the range of 1900 to 9999.
- It accepts the date as the input parameter and provides the return value as Gregorian values regardless of the input value format.
- You can provide a specific date or even a date function as input parameters.
The YEAR function has the below syntax:
YEAR(<Date>)

To use the YEAR function, follow the steps:
Step 1: Create a new measure by specifying a DAX expression using the YEAR function in the formula bar prompt.
YearExample = YEAR(DATE(2024,02,29))

Step 2: Navigate to the Visualizations – Card visual icon. Map the newly created measure to the Fields section of the visual.

This will create a card visual in your report canvas in the Power BI.

#5 – NOW
Overview of NOW function:
- NOW function returns the current date and time in datetime format.
- It has no input parameters and displays the current date and time value every time you open the visual in Power BI.
The syntax of the NOW function:
NOW()
To use the NOW function, follow the steps specified below:
Step 1: In the Power BI Desktop, navigate to the Modeling – New measure.

Step 2: In the formula bar, create a measure by writing a DAX expression using the NOW function.
NowExample = NOW()
Step 3: Navigate to the Visualizations – Card visual and Map the newly created measure to the Fields section of the visual.

It will create a card visual in your report canvas in the Power BI.

#6 – TODAY
Overview of TODAY function:
- The TODAY function returns the current date and hence is helpful for scenarios where you need the current date as a reference point for any calculations or display purposes.
- Unlike the NOW function, it displays the time value as 00:00:00 for all the dates.
To use the TODAY function, use the below syntax:
TODAY()
To use the TODAY function, follow the steps outlined below:
Step 1: Create a measure by writing a DAX expression using the TODAY function in the formula bar prompt.
TodayExample = TODAY()
Step 2: Navigate to the Visualizations – Card visual to create a card visual in Power BI.

#7 – DATE
Overview of DATE function:
- DATE function returns the input date in datetime format.
- It accepts three inputs, i.e., Year, Month, and Day.
- Year – it’s a 4-digit number starting from 1900 with a maximum value of 9999. Any values beyond 9999 or below 0 will result in an error. Any year value specified between 0 and 1899 will be added to 1900
- Month – It’s a number between 1-12. Negative values will throw an error. If a number specified is beyond 12, then it will be added to the beginning of the year value.
- Day – It must be a value between 1 and 31. Any values beyond 31 will be added to the beginning of the month value
- The DATE function is not supported for use in DirectQuery mode in case of any calculated column or row-level security rules.
Now let’s look at the syntax of the DATE function
DATE(<year>, <month>, <day>)

To use the DATE function, follow the steps outlined below:
Step 1: Specify a DAX expression using the DATE function in the formula bar prompt to create a measure.
DateExample = DATE(2024,02,29)

Step 2: Use the newly created measure to create a card visual in Power BI.

#8 – DATEDIFF
Overview of DATEDIFF function:
- The DATEDIFF function returns the number of interval boundaries between the two input dates.
- It accepts two dates and an interval as input parameters. The interval can be one of the following values
- SECOND
- MINUTE
- HOUR
- DAY
- WEEK
- MONTH
- QUARTER
- YEAR
- It returns a positive number if the 2nd input date is greater than the 1st one. Else it returns a negative number.
The syntax of the DATEDIFF function
DATEDIFF(<Date1>, <Date2>, <Interval>)
To use the DATEDIFF function, follow the steps outlined below:
Step 1: Write a DAX expression using the DATEDIFF function in the formula bar prompt.
Datediff Example = DATEDIFF(TODAY(), TODAY() – 730, WEEK)

Step 2: Use the newly created measure to create a card visual in Power BI.

#9 – CALENDAR
Overview of CALENDAR function in Power BI:
- The CALENDAR function returns a table with a date column that contains a list of dates based on the input date parameters (both inclusive).
- The CALENDAR function is not supported for use in DirectQuery mode in case of any calculated column or row-level security rules
Now let’s look at the syntax of the CALENDAR function
CALENDAR(<start_date>, <end_date>)

To use the CALENDAR function, follow the steps outlined below:
Step 1: Navigate to the Modeling tab. Click on the New table option

Step 2: Write a DAX expression in the formula bar prompt using the CALENDAR function to create a Calendar table.
CalendarDateTable = CALENDAR(DATE(2021,01,01),DATE(2024,12,31))

Step 3: Navigate to the Table view to view the newly created table along with the dataset.

#10 – CALENDARAUTO
Overview of CALENDARAUTO function:
- The CALENDARAUTO function returns a table with a date column that contains a list of dates dynamically calculated based on your input data model.
- If the model does not have any datetime value either in calculated columns or tables, an error is thrown.
The syntax of the CALENDARAUTO function:
CALENDARAUTO([FiscalYearEndMonth])

FiscalYearEndMonth parameter can be any DAX expression returning an integer from 1 to 12. If there is no parameter, it defaults to the Calendar table templates for the current user. Else defaults to 12.
To use the CALENDARAUTO function, follow the steps outlined below:
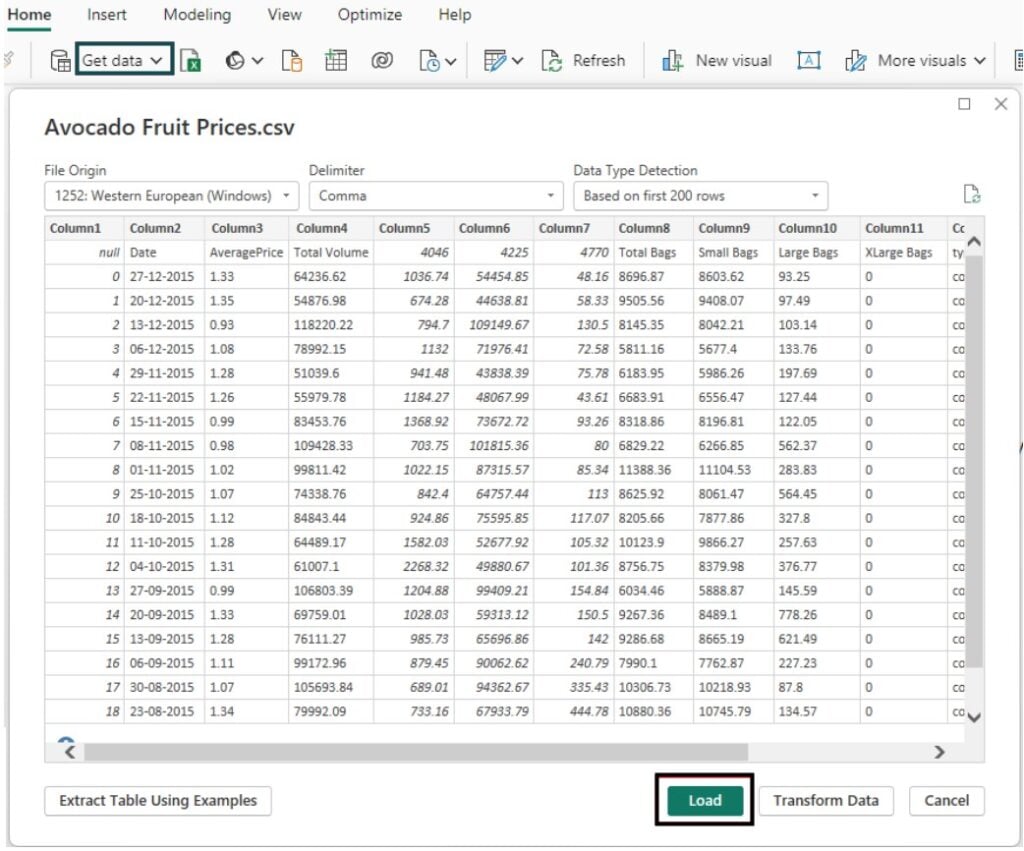
Step 1: Open the Power BI Desktop. Use the Get data option to import your dataset and load it into the Power BI data model. Here we are using the Avocado Fruit Prices dataset for demo purposes.

Step 2: Navigate to the Modeling tab. Click on the New table option

Step 3: Use the DAX expression in the formula bar prompt using the CALENDARAUTO function to create a Calendar table.
CalendarAutoDemo = CALENDARAUTO()

Step 4: Navigate to the Table view to view the newly created table along with the dataset.


Frequently Asked Questions (FAQs)
There are multiple ways you can create a custom date table in Power BI.
• Option 1: Use Power Query Editor to create a Calendar table using M language
• Option 2: Navigate to Modeling – New table. Write DAX expression using CALENDAR or CALENDARAUTO functions to populate the date values
• Option 3: Navigate to File – Options and settings – Options – CURRENT FILE – Data Load. Under the Time intelligence header, enable the Auto date/time option
To filter data by date range in Power BI, follow the steps highlighted below:
• Create a Calendar/date table and establish a relationship between the Calendar/date table and your table containing the dataset using the date columns in both tables
• Either use a slicer visual or DAX expression to filter the required data for your reporting purpose
To extract the day, month, or year from a date using Power BI, use the below functions:
Yes, you can create a dynamic date range or a relative date slicer in Power BI.
Step 1: Create a slicer visual and select a date value
Step 2: Choose the slicer. Under the Format, your visual tab, navigate to Visual – Slicer settings – Options, change Style to Relative Date
This will create a dynamic date range slicer in Power BI.
Recommended Articles
Guide to Power BI Date Functions. Here we explain the list of top 10 Power BI Date functions used for reporting requirements, with examples & points to remember. You can learn more from the following articles –

Leave a Reply