What is RANKX Function Power BI Reports?
The RANKX function in Power BI is a DAX (Data Analysis Expressions) function used to calculate the rank of a value in a column against a specified expression or measure. It considers the context of the current row and assigns a unique rank to each value based on the specified criteria. RANKX Power BI returns the evaluated expression’s rank, similar to the rank function in Excel or other tools.
Table of contents
Key Takeaways
- The Power BI RANKX function is used to calculate the rank of a value based on a specified expression or measure in Power BI.
- It assigns a unique rank to each value based on the context of the current row.
- The Power BI RANKX function can be used with optional parameters such as [value], [order], and [ties] to customize the ranking behavior.
- Ensure a proper understanding of DAX expressions and measures and validate the results to ensure accuracy.
How to use RANKX Function in Power BI?
To use the RANKX function in Power BI, follow these steps:
Import the dataset to the Power BI Desktop using Data Connection.
- Create a New measure or New column for the imported dataset.
- Use the RANKX function in the formula bar, providing the necessary parameters.
The basic syntax of the RANKX function is:

RANKX(<Table>, <Expression>, [Value], [Order], [Ties])
- <Table> – refers to the table or column in which the values are ranked.
- <Expression> – It is the expression or measure that defines the ranking criteria. It is evaluated for each row of the table.
- [Value] – An optional parameter that specifies the value to rank. If not defined, the value of the expression at the current row level is used.
- [Order] – An optional parameter that determines the sort order (ascending or descending) or how to rank the value.
- It has two possible values, 0 and 1. The default value is 0, i.e., ranking in descending order.
- If the value is 1, ranking will be done in ascending order.
- [Ties] – An optional parameter that handles ties in ranking. It supports 2 possible values, Skip and Dense.
- The default value is Skip which means the next rank value in case of a tie is assigned as the rank value of the tie + count of values that are tied. For example,
- if two values have the same rank of 7, then if you specify Skip or keep this parameter blank, the next rank assigned will be 7+2 = 9.
- Similarly, if you specify Dense, the next rank assigned will be the next numeric rank value. For example, if two values have the same rank of 7, then if you specify Dense, the next rank assigned will be 8.
- Adjust the formula and parameters based on your specific requirements.
You can calculate the Power BI RANKX by group, Power BI RANKX by Date, and many more rankings based on grouping. In the subsequent section, we will review some of these examples to understand how to use the Power BI RANKX function.
📊 Unlock Advanced DAX Skills in Power BI!
Take your Power BI skills to the next level with our Advanced DAX in Power BI Training Course. Dive deep into advanced DAX functions, complex calculations, and optimization techniques to enhance your data analysis and reporting capabilities.
Examples of RANKX Function in Power BI
In this section, we will see two examples of a step-by-step process to use the Power BI RANKX function to calculate the Power BI RANKX by group and slicer-based rankings.
Example #1
In this example, we will create a Power BI Table Matrix showing the ranks of students based on total marks and individual test basis using the Student_marks dataset in Power BI. To use the Power BI RANKX function, follow these steps:
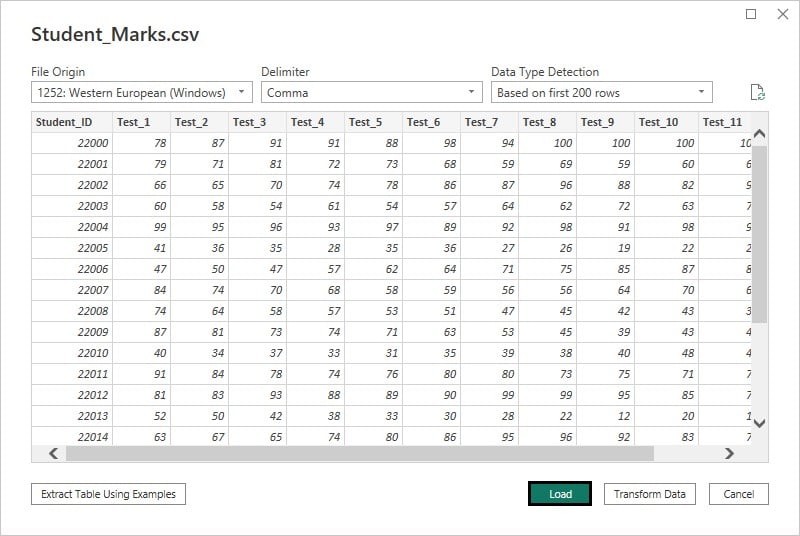
Step 1: Open the Power BI Desktop and import the Student_marks dataset using Data Connection. You can also customize the dataset as per requirement by using the Transform Data option. To load the dataset to Power BI, click on the Load button.
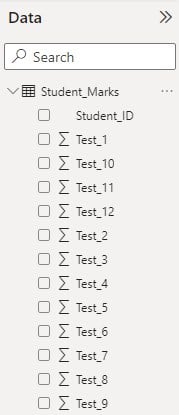
Once imported into Power BI, you will be able to view the data fields in the Fields pane.
Step 2: Navigate to the Fields pane, right-click on the Student_Marks table, and choose the New column option.
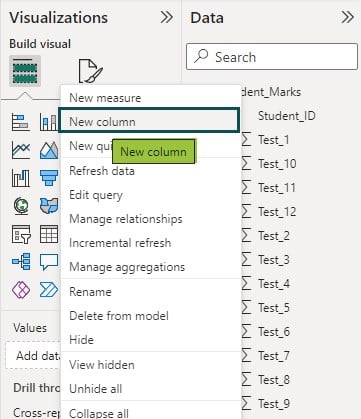
Once you choose the New column option, you will see a prompt in the formula bar.
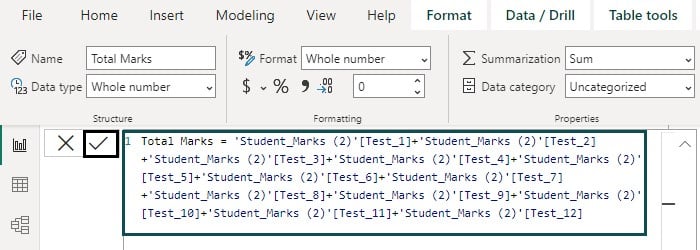
Step 3: Enter the DAX expressions in the formula bar to create the Power BI columns for the Student_Marks table.
We have created three different columns in the Student_Marks table. The total Marks column calculates the total test score for each student across all the tests.
Rank of Student by Total Marks column calculates the rank of each student based on the total score.

Rank of Student by Test_2 column calculates the rank of each student based on the score in Test_2.

Note that we have used Dense and Skip values for <Ties> parameter to calculate the rank values.
Step 4: Click on the Commit icon to save the changes for each of the above changes to create new columns.
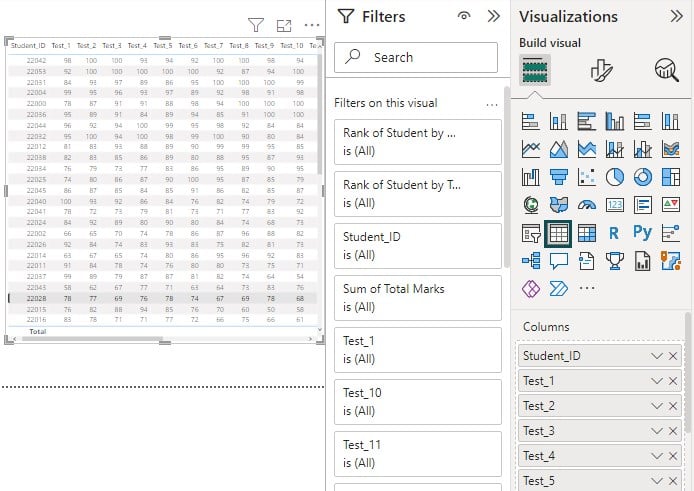
Step 5: Navigate to the Visualization pane, choose the Table visual, and drag and drop the attributes from the Fields pane to the report canvas to create a matrix visual.
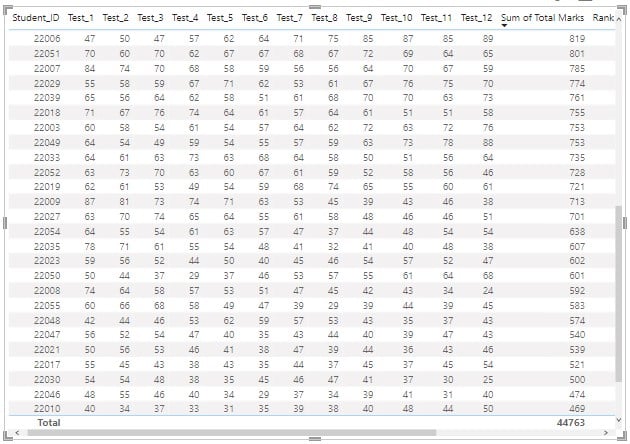
Note that the Power BI RANKX function has assigned the ranks (Rank of Student by Total Marks) based on the total marks scored by each of the students (Student_id).
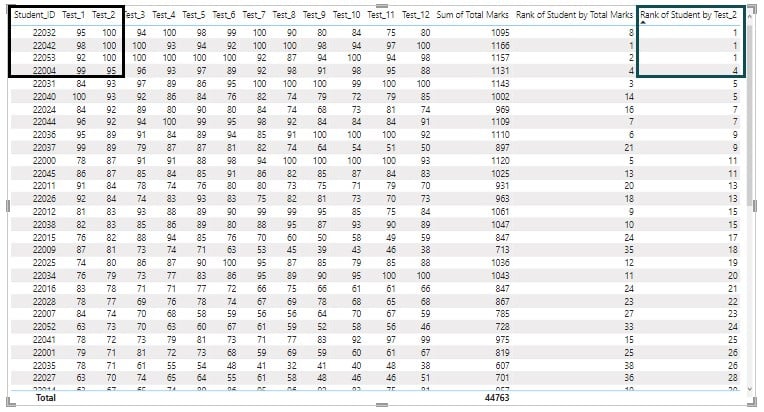
However, if you observe the rank values for the Rank of Student by Test_2, three students, i.e., Student_id 22032,22042, and 22053, have scored 100 in Test_2 and been assigned the same rank 1. Similarly, the next rank is 4 for student_id 22004, who scored 95 in Test_2. It is because of the Skip parameter we have defined for the RANKX function.
Similarly, you can calculate different Power BI RANKX by group or Power BI RANKX by date columns or measures for your Power BI reports.
Example #2
In this example, we will use the Power BI RANKX function to rank the countries based on GDP and Life expectancy and rank them dynamically using slicers by sourcing the World Data Set dataset across different years to create a Power BI Visual. To use the Power BI RANKX function, follow these steps:
Step 1: Open the Power BI Desktop and import the World Data Set file using Data Connection in Power BI.
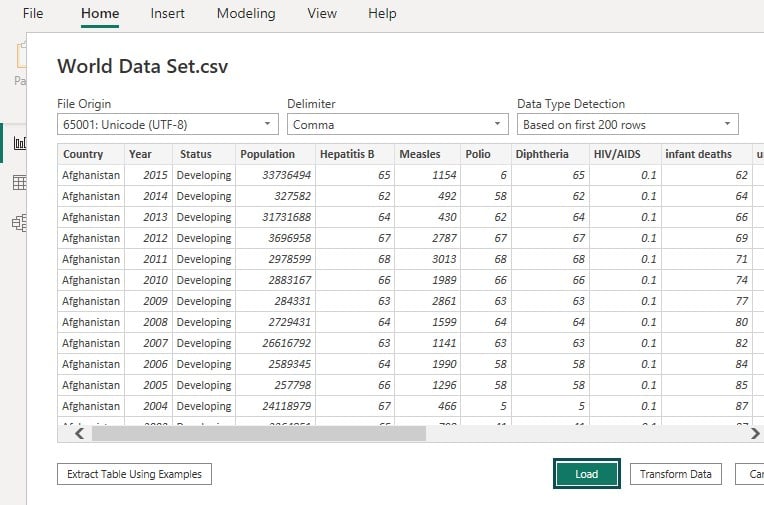
Once imported to Power BI successfully, you can see the data attributes in the Fields pane.

Step 2: Navigate to the Fields pane, right-click on the World Data Set table, and choose the New column option.
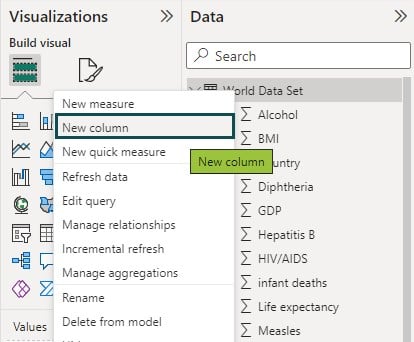
Once you choose the New column option, you will see a prompt in the formula bar.
Step 3: Enter the Power BI DAX expressions in the formula bar to create the Power BI columns for the World Data Set table. We have created 2 different columns in the World Data Set table.
The total Marks column calculates the total test score for each student across all the tests.

The rank of Country by GDP column calculates each country’s rank based on GDP values.

The Rank of Country by Life Expectancy column calculates each country’s rank based on their life expectancy scores.

Step 4: Click on the Commit icon to save the changes for each of the above changes to create the new columns.
Step 5: Navigate to the Fields pane, right-click on the World Data Set table, and choose the New measure option.
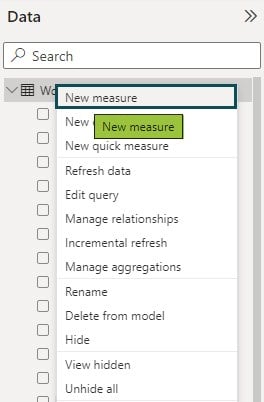
Step 6: Enter the DAX expressions in the formula bar to create the Rank of Country by GDP by Year Slicer measure on the World Data Set table.

Step 7: Navigate to the Visualization pane, choose the Table visual, and drag and drop the attributes from the Fields pane to the report canvas to create a Table matrix visual.
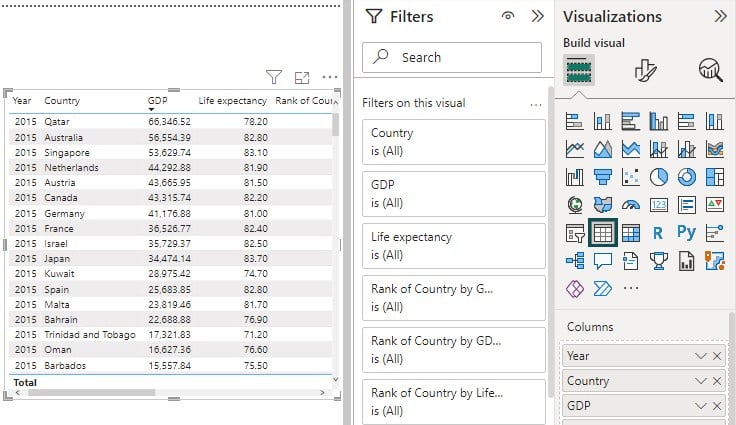
As you can see Power BI Desktop has ranked the countries as per their GDP values and stored it in Rank of Country by GDP and Rank of Country by GDP by Year Slicer.
Step 8: Navigate to the Visualization pane, choose Slicer visual, and add the Year to the Field section.

This will add a slicer to the report canvas with Year values to choose from for filtering the dataset.
Step 9: Navigate to the Format your visual tab under the Visualization pane and apply Slicer formatting.

Now you will see the Table Matrix visual along with Year Slicer.
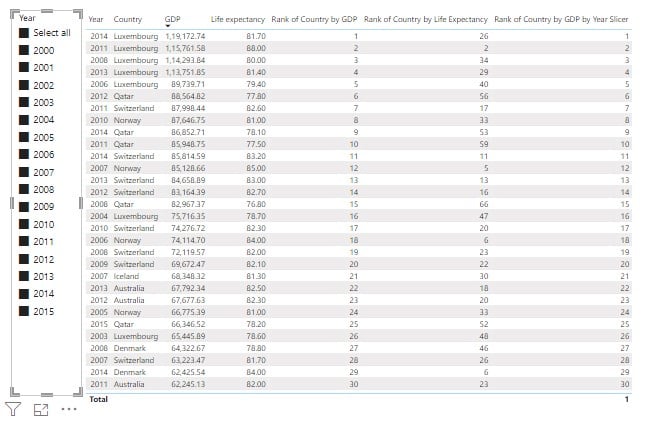
Step 10: Select any year from the Year slicer, and you will see the ranking changing dynamically as per the GDP values applicable for the selected year.
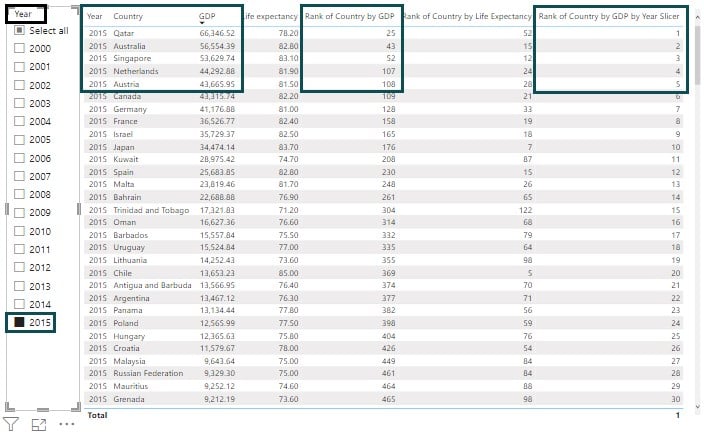
As you can see, the Rank of Country by GDP by Year Slicer measure has ranked the countries as per the GDP values applicable for 2015, while the Rank of Country GDP column has ranked based on the total GDP values of countries across all the years.
Important Things to Note
- The RANKX function requires a proper understanding of DAX expressions and measures.
- Ensure the data model in excel is properly set up, with appropriate table relationships.
- The Power BI RANKX function can be resource-intensive for large datasets, so use it judiciously.
- Consider the context in which the RANKX function is applied, as it calculates the rank based on the current row’s context.
- Test and validate the results of the RANKX function to ensure accuracy and correctness.
Frequently Asked Questions (FAQs)
In Power BI, the RANK and RANKX functions are used for different purposes.
TopN is not a function in Power BI but rather a concept combined with the RANKX function. The TopN concept retrieves the top or bottom N values from a column based on a specific measure or expression.
Regarding the issue of the RANKX function not working, there could be various reasons. Some possible reasons include incorrect usage of the function, issues with the data model relationships, or incorrect measures or expressions used for ranking. It’s important to double-check the syntax and the underlying data to identify any potential issues.
If you’re looking for an alternative to the RANKX function in Power BI, you can use the TOPN function in combination with other DAX functions like FILTER and CALCULATE. The TOPN function allows you to retrieve the top or bottom N values from a column based on a specific measure or expression. It provides similar functionality to the RANKX function when used with the appropriate filters and calculations.
Recommended Articles
This has been a guide to Power BI RANKX Function. Here we learn step-by-step process to use the Power BI RANKX function to calculate the Rank with examples. You can learn more from the following articles –

Leave a Reply