
What is SKEW Function in Google Sheets?
The SKEW function in Google Sheets is used to calculate the skewness of a data set. If you are unaware, the skewness measures the lack of symmetry in the distribution of data points. If we obtain a positive skew, it indicates that the data tail is skewed to the right. A negative skew indicates a skew towards the left. Therefore, the SKEW function calculates the skewness of a dataset, which is the symmetry of that dataset about the mean. It helps us understand if the data tends to move towards higher or lower values.
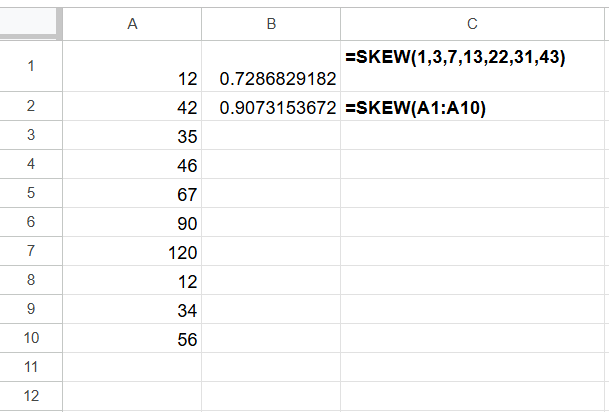
For example, we can find the skewness of some random values, as shown below. We can either directly enter the values or use cell references, as shown below, to find the skewness.
Use this SKEW Function in Google Sheets Template to follow along with the examples in this article.
Download Excel Template=SKEW(1,3,5,7,9,11,13)
=SKEW(A1:A10)
The results are shown below.
Key Takeaways
- The SKEW function is used to calculate the skewness of a distribution based on a sample of data. The SKEW function measures the asymmetry of a distribution around its mean.
- The syntax of the SKEW function is:
- =SKEW(value1, [value2,…])
- value1 (mandatory): A data point or range of cells containing the data to analyze.
- value2 (optional): Additional data points or ranges to analyze.
- A positive result from the SKEW function in Google Sheets indicates that the distribution has an asymmetric tail which is more towards positive values while a negative skewness indicates an asymmetric tail towards more negative values.
- The function is helpful in quality control, financial analysis, income distribution calculation, and so on.
Syntax
Wondering what is the uses of the SKEW function? It mainly helps you understand the distribution of your data. Combined with other values like the mean and standard deviation, you get full clarity on your data’s distribution. Here’s a syntax of the SKEW function in Google Sheets.
=SKEW(data1, [data2, …])
data1, data2, …: These values are those for which you want to calculate the skewness.
How to Use SKEW Function in Google Sheets?
In statistics, skewness measures the shape of a distribution. In other words, skewness measures the asymmetry of a distribution. Let’s try to understand how to use skewness in Google Sheets. There are two ways to enter the function.
- Entering SKEW in Google Sheets manually
- Through the Google Menu bar
Suppose we have the following dataset. It indicated the temperature of a city every day in a fortnight.

Step 1: Now, let us calculate the skewness of these data points. Enter the following formula in B16.
=SKEW(
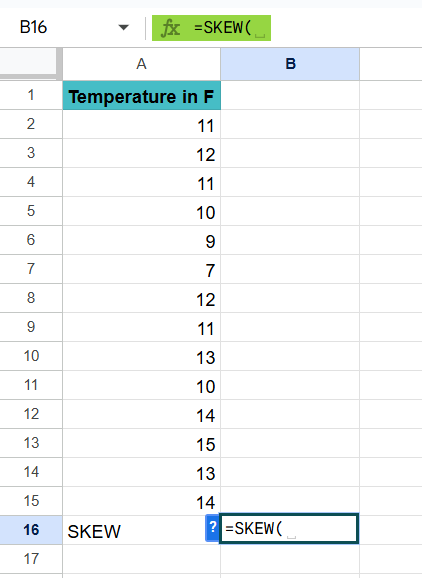
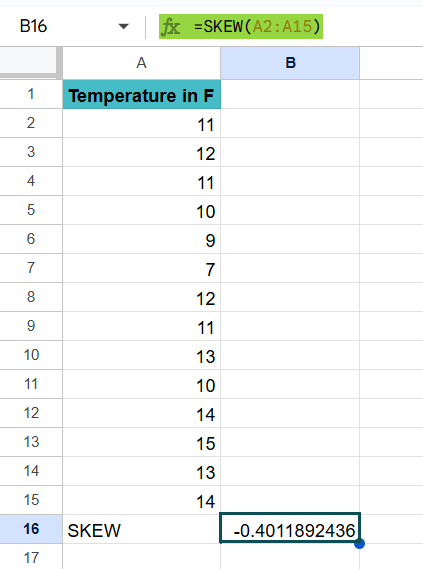
Step 2: Enter range you wish to find the skewness for. Here, we enter the range from A2:A15. Close the parentheses.

Step 3: Press Enter. We get the skewness of this temperature dataset. Simple to use, isn’t it? The result shows that the returns distribution has a leftward bias which means that it has more frequent small positive changes and occasional large negative changes.
Using the Google Menu bar
- We can also enter the function through the Google Menu bar.
- Go to the menu bar and click on “Insert” ➝ “Function” ➝ “Statistical” ➝ “SKEW.”
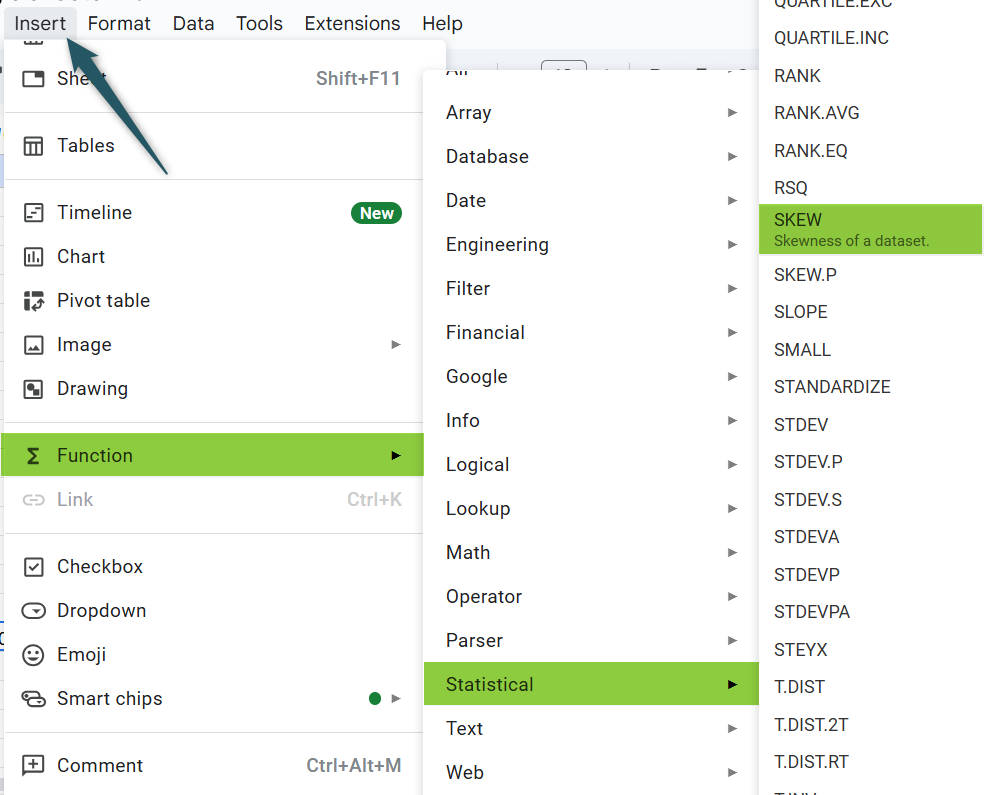
- Enter the argument as a range or direct values. Close the parentheses and press the “Enter” key.
Examples
When calculating the skewness using the SKEW function, a positive skewness means the distribution has an asymmetric tail that tends more toward positive values, while a negative skewness indicates it extends toward more negative values. This calculation is helpful in fields such as financial analysis and other statistical applications. Let us look at some practical Skew in Google Sheets examples.
Example #1 – Analyzing the daily returns of a stock over the last month
In this example, we analyze the daily returns of a stock over the last month using the SKEW function in Google Sheets. We have a very helpful function in Google Sheets called Googlefinance which will give the daily closing prices for any company from the last 30 days.
Step 1: Let us find the daily closing prices for Apple Inc. over the last 30 days.
=GOOGLEFINANCE(“AAPL”, “close”, TODAY()-30, TODAY()). Press Enter. You get the prices of Apple over the last 30 days.
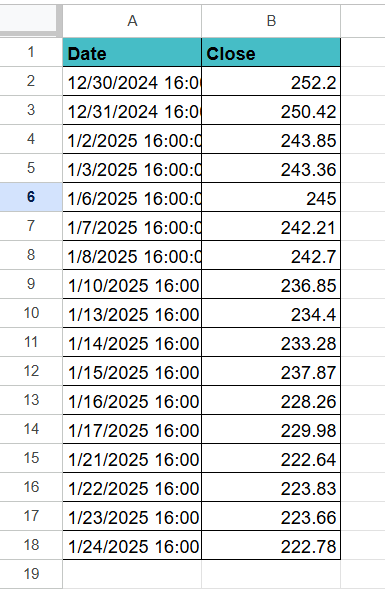
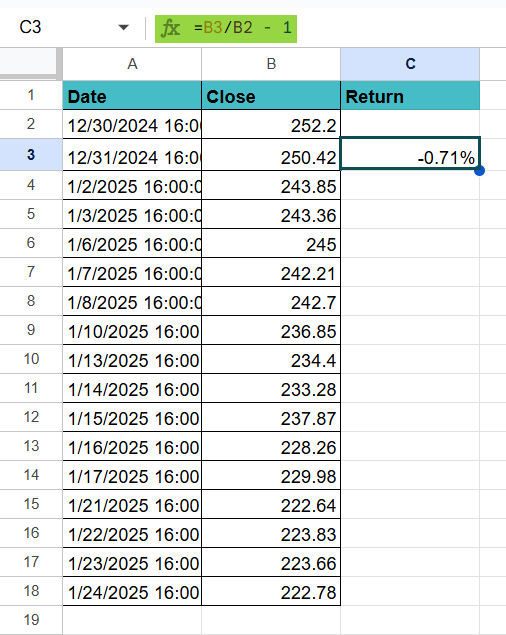
Step 2: We can see Apple Inc.’s daily closing prices in column B. Let’s calculate the returns in Column C. Enter the following formula to calculate the returns in Column C.
In cell B3: B3/B2 – 1. Press Enter and choose the percentage from the menu bar. It will give the percentage return for that day.
Step 3: Drag the formula all the way to cell C19.
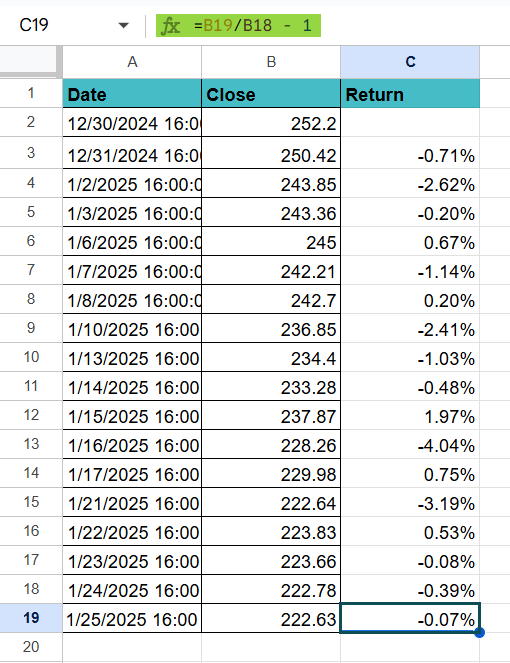
Step 4: The daily returns are now in column C. You can calculate the skewness using the SKEW function.
Enter the following function in cell D2.
=SKEW(C3:C19).
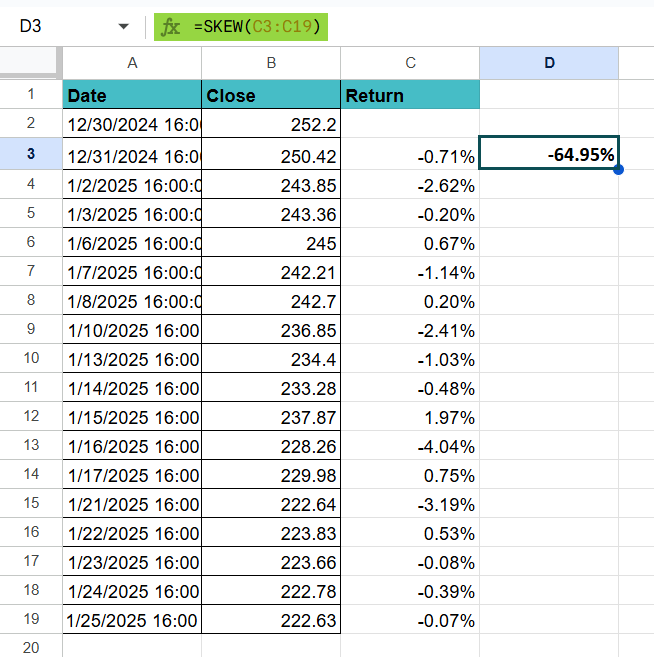
Due to the negative number, the returns distribution has a leftward bias. This means there are more frequent small positive returns and periodic large negative returns. Thus, the SKEW formula in Google Sheets calculates the skewness of a specified range of data points.
Example #2 – Reviewing the monthly sales data of a product over the past year
Let’s use the SKEW function with a practical, commonplace scenario. Suppose you run a business selling products and are tracking the monthly sales of one of your products over the last year. The SKEW function helps you understand the distribution of your sales numbers for better marketing decisions.
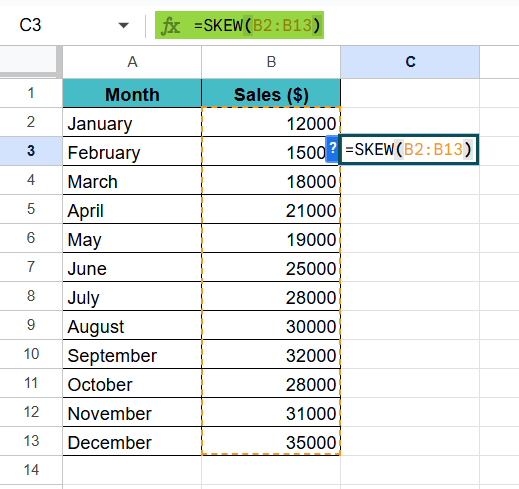
Step 1: Enter your sales data over the past year as shown below.

Step 2: To find the skewness of the above sales data, let us use the SKEW function on the Sales ($) column. Enter the following function cell C3.
=SKEW(B2:B13)
Step 2: Press Enter.
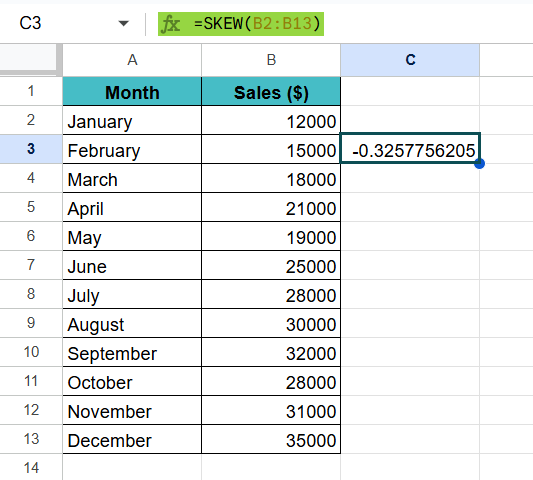
It will give you a value that shows how your sales are skewed. If the result is positive, your sales skew towards higher numbers. It indicates that you have had many months with particularly high sales. A negative result, as shown above, suggests the opposite.
Example #3
In Google Sheets, we use the SKEW function to measure the skewness of a data set. It shows you how much a distribution deviates from a normal distribution. A positive skew means a longer tail on the right side, and a negative skew indicates a longer tail on the left. In the example below, let us try to plot the same on a histogram.
Let us follow these simple steps to combine the SKEW function with a histogram.
Step 1: Arrange the data in a table as shown below. Here., we have some values in Column A.
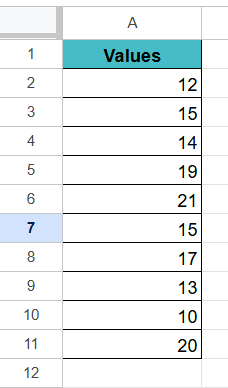
Step 2: We apply the following function in cell B2 to calculate the skewness.
=SKEW(A2:A11). Press Enter.

Step 3: You can observe a positive skew value, which means that the tail of the distribution is on the right and extends towards more positive values. Let us try to plot a histogram for the same.
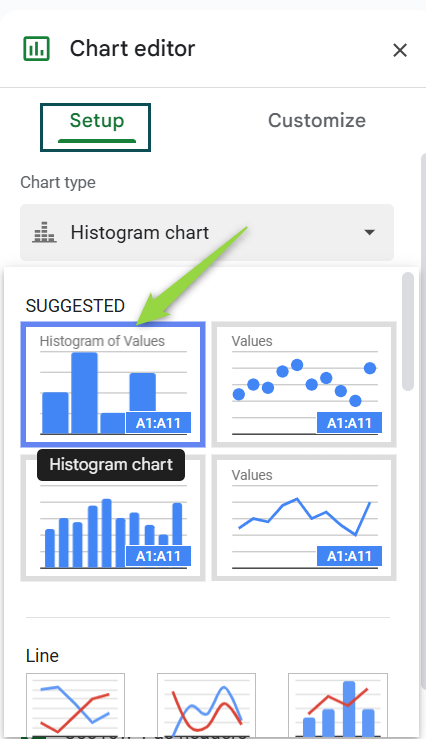
To visualize the distribution with a histogram, first select the data range (A2:A11).
Next, go to the menu: Insert → Chart.

In the Chart Editor, change the chart type to “Histogram.” By default, you will usually get a histogram chart.
Adjust the “Bucket size,” which can be found under “Customize” → “Histogram,” to set the required intervals. You will get a histogram, as shown below.
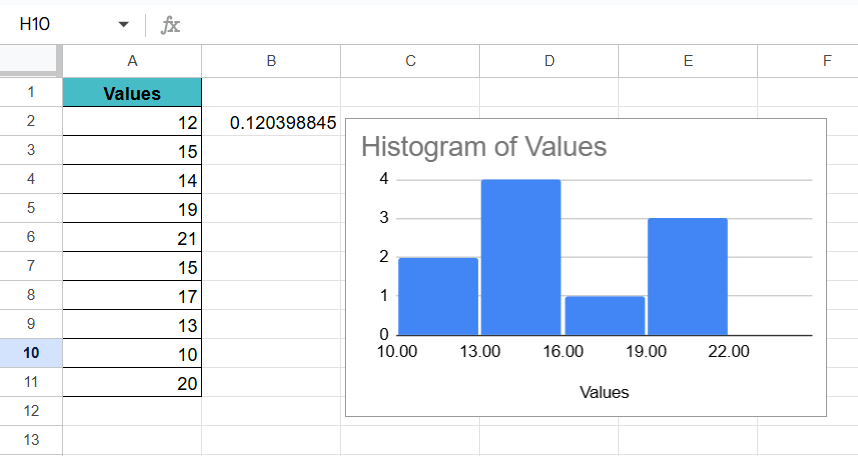
As the skewness value is near to 0, which is 0.1, the histogram is somewhat bell-shaped.
Important Things to Note
- In Google Sheets, the SKEW function can take up to 30 arguments.
- If the number of values given as arguments is not greater than two, the SKEW function will return the #DIV/0! Error.
- Text values, if present in the value arguments, are ignored.
- Skewness is calculated according to the distribution of data. If you provide more data points, your calculation will be more correct.
Frequently Asked Questions (FAQs)
Skewness can show if the data tends to drift towards higher or lower values. For example, if you’re analyzing a data of the bonus received by a group of employees, a positive skew indicates that there are a few people with very high bonuses compared to the rest.
Positive Skew: It shows that the right tail is longer, meaning there are more values on the higher end.
Negative Skew: The left tail is longer. Therefore, there are more values on the lower end.
Zero Skew: Symmetrical distribution.
1. Stock Market Analysis: To analyze a stock’s returns to see if the distribution of the returns is skewed.
2. Financial Analysis: To calculate the distribution of sales figures to assess performance or risk.
3. Income: Skewness can be used to analyze income distribution across an organization.
4. Quality Control: Can find product defect rates to identify production issues.
The SKEW function returns a #DIV/0! error if:
There are less than three data points
The standard deviation of the sample is zero
Use this SKEW Function in Google Sheets Template to follow along with the examples in this article.
Download Excel Template