
What Is Confidence Interval In Excel?
The confidence interval in Excel is a range of values set around the known sample mean. The CONFIDENCE() utilizes a Normal Distribution to determine the confidence value, which is useful for determining the confidence interval for the population mean.
Users can use the CONFIDENCE() while performing statistical and financial analysis. But the function got replaced by the functions CONFIDENCE.NORM and CONFIDENCE.T, with superior accuracy, in Excel 2010. And thus, it is now available as an inbuilt Compatibility Excel function for backward compatibility.
Use this Confidence Interval In Excel Template to follow along with the examples in this article.
Download Excel TemplateFor example, the significance level is 0.05 for the mean of a sample lap time on track for 35 athletes. And the sample mean is 40 seconds, with the standard deviation being 2 seconds.

And the requirement is to compute the confidence interval for the given population mean in cell B7.
Then, we can apply the CONFIDENCE() in the target cell and calculate confidence interval in Excel by supplying the given data as the function arguments.

The above example explains the 95 confidence interval in Excel scenario, as alpha is 0.05, which indicates a confidence level of 95%.
Thus, the required confidence interval is 40 ± 0.66258876, which equals the range of 39.33741 to 40.66259 seconds.
Key Takeaways
- The confidence interval in Excel is a data range centered around the sample mean. And the CONFIDENCE() returns the confidence value based on the Normal Distribution, which helps calculate the confidence interval for the population mean.
- While CONFIDENCE() helps perform financial analysis, statistically, the function got replaced by the functions CONFIDENCE.NORM and CONFIDENCE.T.
- As inputs, the CONFIDENCE function accepts three mandatory arguments, alpha, standard_dev, and size.
- You can use the Descriptive Statistics option from the Data Analysis ToolPak to determine the confidence value and, eventually, the confidence interval.
Confidence Interval() Excel Formula
The function to determine the confidence interval in Excel is:

where,
- alpha: The significance level required for determining the confidence level. It is the difference between the value one and confidence. So, a significance value of 0.05 represents a 95% confidence level and thus helps calculate a 95 confidence interval in Excel.
- standard_dev: The known population standard deviation for the value range.
- size: The sample data size.
The three arguments in the above CONFIDENCE() syntax are mandatory.
How To Calculate Confidence Interval In Excel?
We can calculate the Confidence Interval function in Excel in 2 ways, namely:
- Access from the Excel ribbon.
- Enter in the worksheet manually.
Method #1 – Access From The Excel Ribbon
Select the target cell and click the Formulas tab → click the More Functions option drop-down → click the Compatibility option right arrow → select the CONFIDENCE function, as shown below:

The Function Arguments window appears. Enter the arguments in the Alpha, Standard_dev, and Size fields → click OK, as shown below.

Method #2 – Enter In The Worksheet Manually
- Select the target cell.
- Type =CONFIDENCE( in the cell. [Alternatively, type =C or =CONF and double-click the CONFIDENCE function from the Excel suggestions.]
- Enter the arguments as cell values or references and close the brackets.
- Press Enter to execute and get the CONFIDENCE() output, the confidence value.
- Finally, calculate the confidence interval in Excel using the below formula:

Let us now see how to calculate confidence interval in Excel with an example.
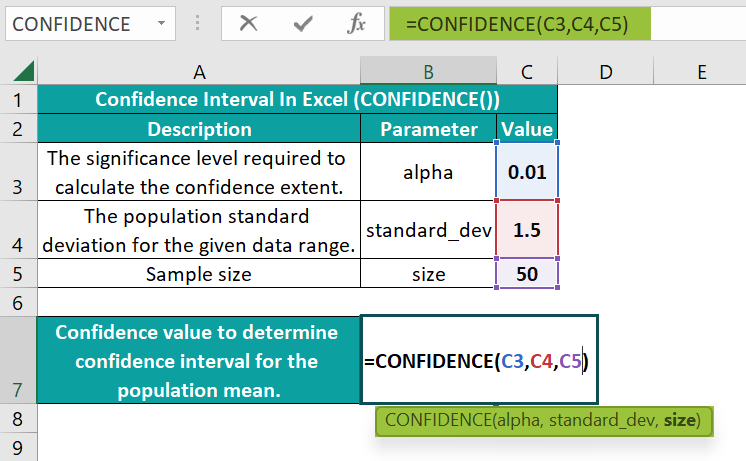
Consider the significance level is 0.01 for the mean of a sample age of 50 people. And the sample mean is 25 years, with the standard deviation being 1.5 years.

And the requirement is to determine the confidence interval for the given population mean in cell B7.
The steps to calculate confidence interval in excel are as follows –
- To begin with, select the target cell B7 and then, enter the below CONFIDENCE().
=CONFIDENCE(C3,C4,C5)

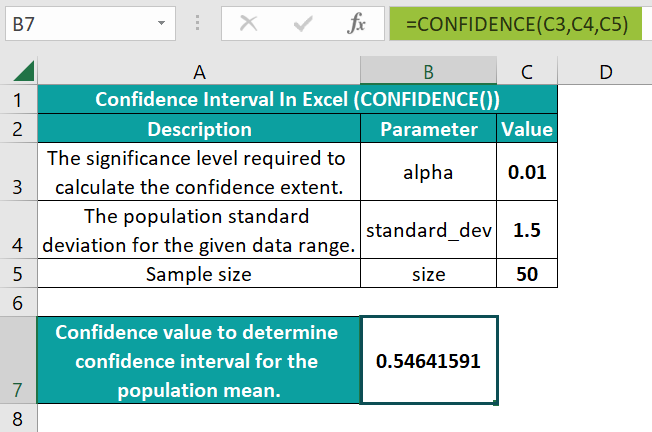
- Next, press Enter to execute the CONFIDENCE().

The CONFIDENCE function accepts three values as arguments, 0.01, 1.5, and 50, to return the confidence value of 0.546.
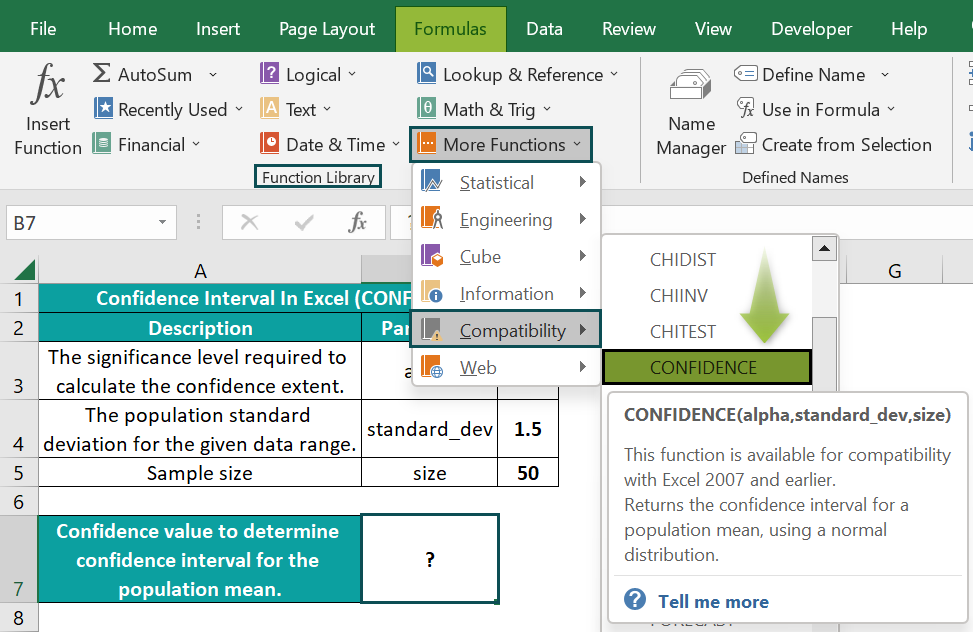
Alternatively, we can select the target cell B7 and click Formulas → More Functions → Compatibility → CONFIDENCE to access the Function Arguments window.
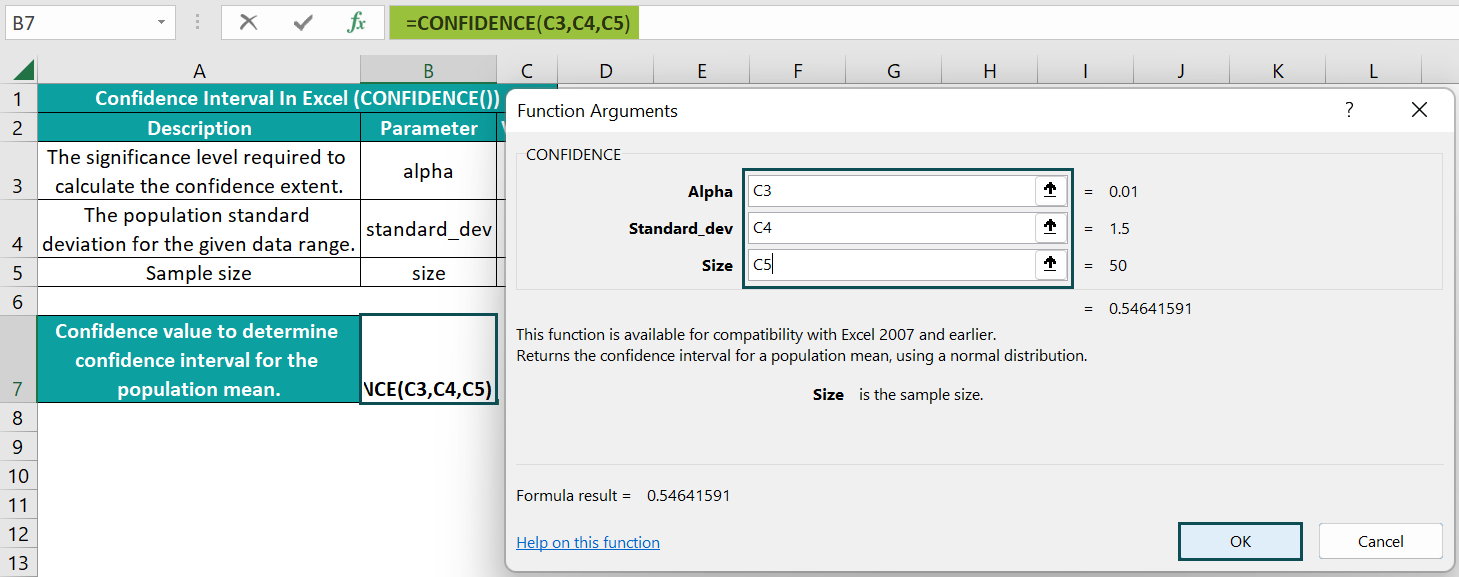
Next, enter the CONFIDENCE() arguments in the respective fields in the Function Arguments window.
And once we click OK, the CONFIDENCE() will get executed in the target cell. - Using the sample mean value of 25 years and the CONFIDENCE() output in the confidence interval formula, determine the confidence interval for the population mean.
= 25 ± 0.546
Thus, the required confidence interval of values around the sample mean of 25 is 25 ± 0.546, or 24.454 to 25.546 years.
Examples
Check out the following illustrations to learn how to calculate the confidence interval in Excel.
Example #1
Suppose we have a sample of 12 months’ average temperatures recorded in Texas.

And the requirement is to compute the confidence interval for the population in cell E8 in the second table.
In this example, we need to calculate the CONFIDENCE() argument values to apply the function in cell E7 and compute the required confidence interval in the target cell E8.
- Step 1: First, select cell E3, enter the AVERAGE excel function to find the sample mean, and then, press Enter.
=AVERAGE(B3:B14)

- Step 2: Next, select cell E4, enter the STDEV.P() to determine the population standard deviation for the given dataset, and then press Enter.
=STDEV.P(B3:B14)

- Step 3: Then, select cell E5, and enter the total number of observations in the sample data.

- Step 4: Now, select cell E6, and then, enter the significance level, alpha, as 0.03, implying a 97% confidence level.

- Step 5: Next, select cell E7, enter the CONFIDENCE(), and then, press Enter.
=CONFIDENCE(E6,E4,E5)

- Step 6: Now, enter the confidence interval in Excel cell E8 using the below formula.
=CONCATENATE(ROUND(E3,1),” ± “,ROUND(E7,2))

The ROUND excel function rounds the mean and confidence values to 1 and 2 decimal places, respectively. And the CONCATENATE excel function concatenates the rounded-up values and the ‘±’ symbol.
Thus, the required confidence interval of values centering around the sample mean of 70.5 is 70.5 ± 6.74, equaling the value range of 63.76 to 77.24 °F.
Please Note: The suggestion is to use the STDEV.S() and STDEV.P() to determine the sample and population standard deviation, respectively. And apply the CONFIDENCE.T() when we do not have the population standard deviation information and the sample size is below 30.
Further, consider the following steps to determine the sample means and confidence values for three more states, Georgia, California, and Washington. Assume the same significance level of 0.03.

And the requirement is to plot the confidence interval in Excel graph for the above data.
Then, the steps are as follows:
- Step 1: To begin with, select the cell range B2:C6 and then, pick the Excel Bar Chart type from the Insert tab.

Next, select the 2-D Clustered Column chart.


- Step 2: Next, click Chart Elements (‘+’ icon) → The arrow against the Error Bars option → More Options to open the Format Error Bars pane.

- Step 3: In the Error Bars Options tab of the Format Error Bars pane, first, click Custom, and then, click the Specify Value option to open the Custom Error Bars window.

- Step 4: Next, enter the Positive Error Value, and Negative Error Value ranges as cell range D3:D6.

- Step 5: Then, click OK to close the Custom Error Bars window and close the Format Error Bars pane to view the plot as depicted below:

- Step 6: Now, click the chart area to enable the Chart Elements option, and then, check the Axis Titles option.

- Step 7: Update the chart and axis titles using the corresponding elements in the chart area.

Thus, in the above confidence interval in Excel graph, the bars represent the states’ sample mean values, and the error bars indicate the corresponding confidence values.
And let us consider the Washington state’s data for plot interpretation. The mean value for Washington is 58.9°F. And the 97% confidence interval for this mean ranges from 56.96 to 60.84°F, which the plot corroborates.
Example #2
The CONFIDENCE.NORM() and CONFIDENCE.T() are inbuilt Statistical functions, and we can access them by navigating the path Formulas → More Functions → Statistical.
The CONFIDENCE.NORM() definition is the same as CONFIDENCE(). On the other hand, the CONFIDENCE.T() determines the confidence interval for a population mean utilizing the Student’s t distribution.
Furthermore, all three functions have the same syntax (Refer to the Confidence Interval() Excel Formula).
We shall see how the latest functions, CONFIDENCE.NORM and CONFIDENCE.T, work with an example.
Consider the significance level of 0.01 for the mean sample height values for 100 men. And the sample mean is 70 inches, with the standard deviation being 3.5 inches.

And the requirement is to determine the confidence interval for the population mean. Assume we must display the results in cell range C10:C12.
Then, here is how we can apply the three abovementioned functions and obtain the confidence value to calculate the confidence interval.
- Step 1: Select the target cell C10, enter the CONFIDENCE(), and press Enter.
=CONFIDENCE(D4,D5,D6)

- Step 2: Select the target cell C11, enter the CONFIDENCE.NORM(), and press Enter.
=CONFIDENCE.NORM(D4,D5,D6)

- Step 3: Select the target cell C12, enter the CONFIDENCE.T(), and press Enter.
=CONFIDENCE.T(D4,D5,D6)

The above output shows the CONFIDENCE() and CONFIDENCE.NORM() return the same confidence value. And, as the CONFIDENCE.T() uses the Student’s t distribution to compute the confidence value, it returns a different value.
Thus, the confidence intervals are 70 ± 0.901 inches (Based on CONFIDENCE() and CONFIDENCE.NORM() output) and 70 ± 0.919 inches (Based on CONFIDENCE.T() output).
Example #3
Consider a class’s test scores following a normal distribution. And we will take a random sample of 7 students’ test scores.

And the requirement is to calculate a 95% confidence interval for the average score.
Then, we can use the confidence interval in Excel Data Analysis option, Descriptive Statistics, to get the required output.
But first, we must install the Analysis ToolPak add-in to use the Data Analysis feature from the Data tab.
- Step 1: The below image shows the Data tab does not contain the Data Analysis feature. So, click File.

- Step 2: Click Options.

- Step 3: The Excel Options window opens up. Here, we must click Add-ins → Analysis ToolPak → Go.

- Step 4: The Add-ins window appears, where we need to check the box against Analysis ToolPak and click OK to view the Data Analysis feature in the Data tab.


We shall now see how to use the Descriptive Statistics option to obtain the required confidence interval in Excel Data Analysis.
- Step 1: Go to Data → Data Analysis to open the Data Analysis window.

- Step 2: Pick Descriptive Statistics from the list of Analysis Tools in the Data Analysis window to access the Descriptive Statistics window.

- Step 3: Update the fields in the Descriptive Statistics window, as depicted below.

The sample data is the input range. And as we require the labels in the first row, select the cells in the input range as C1:C8 to include the column header.
The Grouped By should be Columns, and let the Output Range be a cell address in the active sheet to display the output in the same sheet as the sample data.
Check the Summary statistics to view the entire confidence value calculation. And as the required confidence level is 95%, check the box against the field. Finally, check the boxes against the last two fields and enter their values as one to show the highest and lowest scores in the outcome.
- Step 4: Finally, click OK to obtain the below output.

Thus, the margin of error, or the confidence value, is 1.6719244. So, the confidence interval is 85.89 ± 1.67, or the score range of 84.22 to 87.56.
Further, the third table shows the confidence interval calculations using the CONFIDENCE function.

Refer to column J for the formulas in column I applied to get the required output.
We use the STDEV.S() to determine the sample standard deviation. And we apply the CONFIDENCE.T() as we do not have the population standard deviation information, and the sample size is below 30.
Thus, both methods result in the same confidence value of 1.6719244.
Important Things To Note
- For a non-numeric argument value, the CONFIDENCE() throws the #VALUE! error.
- The CONFIDENCE() truncates a non-integer size argument value while determining the confidence interval in Excel.
- For an alpha ≤ 0 or ≥ 1, standard_dev less than or equal to 0, or size less than 1, the CONFIDENCE() output is the #NUM! error.
Frequently Asked Questions (FAQs)
We can manually calculate the confidence interval value in Excel using the following confidence value formula: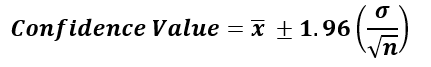
where,
• ̅x: Sample mean
• σ : Standard deviation
• n : Sample size
The assumption is that the alpha is 0.05, and thus the confidence level is 95%. So, it implies the area under the standard normal curve equaling the value of 1 – alpha is ±1.96.
Let us see how to use the above formula to determine the confidence interval.
Consider a sample scenario for which the below table provides the mean value, significance level, standard deviation, and sample size data.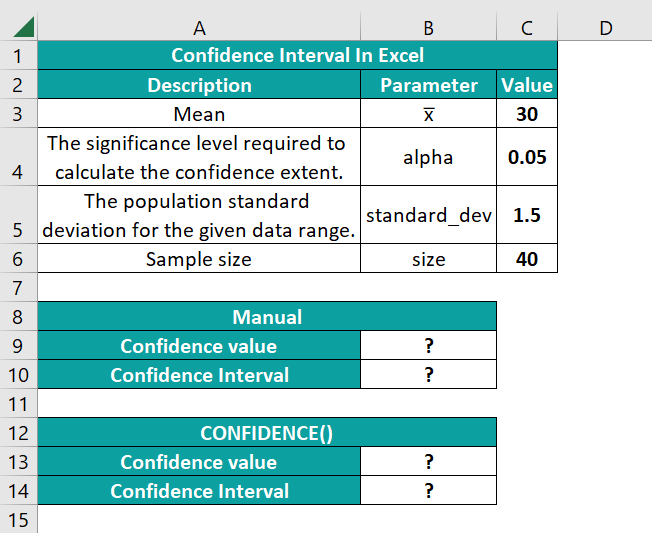
And the requirement is to determine the confidence interval for the given scenario manually in cell B10 and using the CONFIDENCE() in cell B14.
Then, the steps are as follows:
• Step 1: Select cell B9, enter the below formula for the confidence value manual calculation, and press Enter.
=1.96*(C5/SQRT(C6))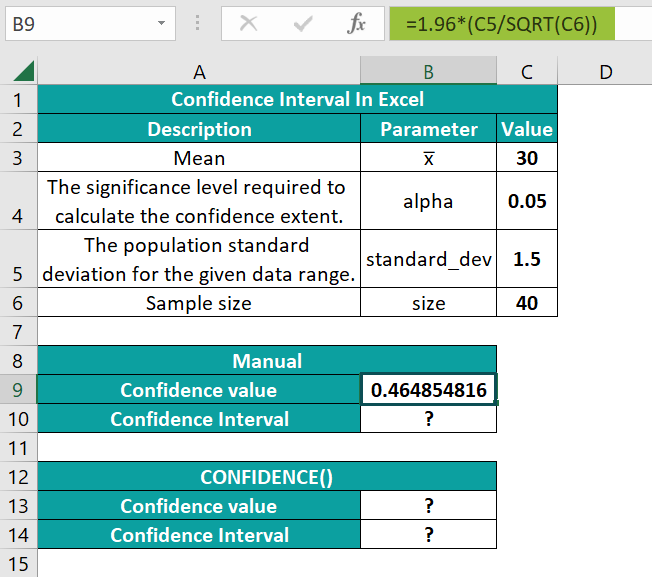
• Step 2: Select the target cell B10, enter the following formula to determine the confidence interval and press Enter.
=CONCATENATE(ROUND(C3,2),” ± “,ROUND(B9,2))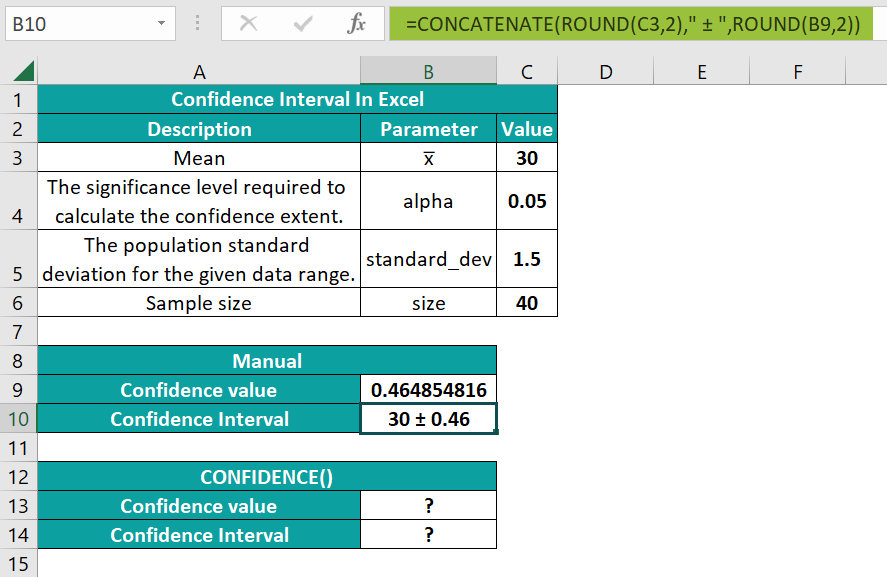
• Step 3: Select cell B13, enter the CONFIDENCE(), and press Enter.
=CONFIDENCE(C4,C5,C6)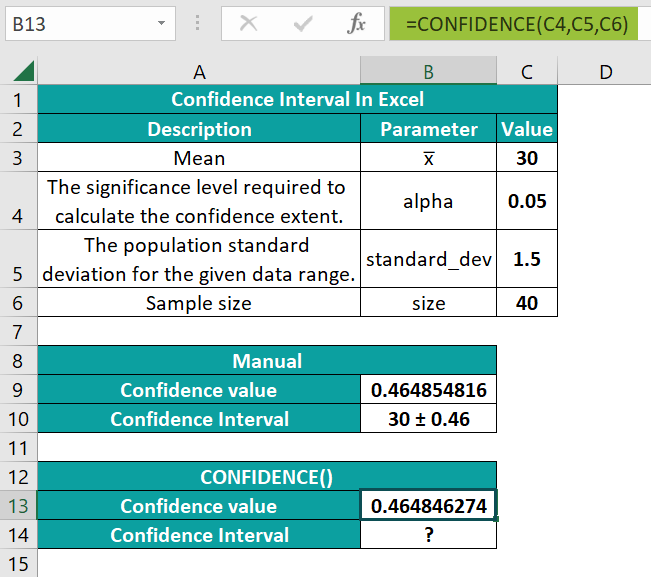
• Step 4: Select the target cell B14, enter the below formula to obtain the confidence interval, and press Enter.
=CONCATENATE(ROUND(C3,2),” ± “,ROUND(B13,2))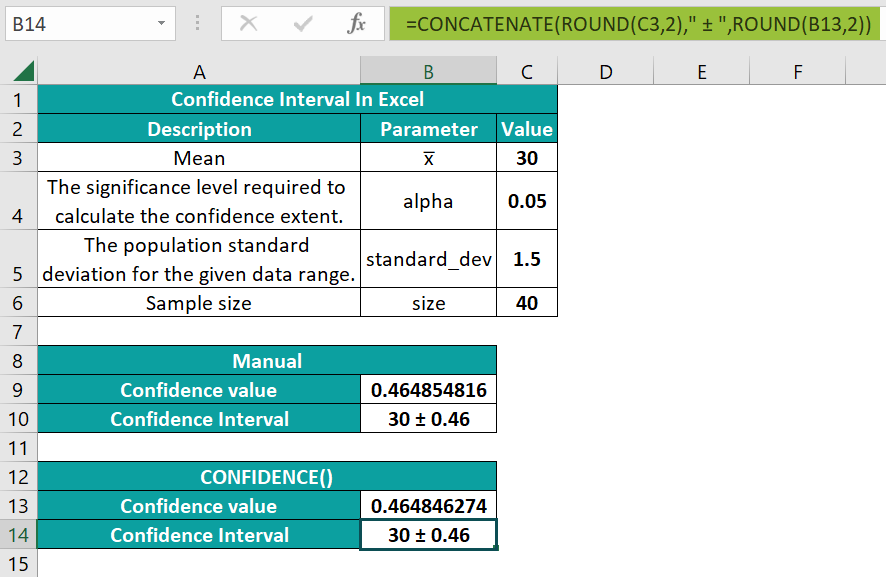
Thus, calculating the confidence value manually and using the CONFIDENCE() give the same confidence interval.
We can evaluate the upper and lower limits of the confidence interval or range in Excel using the following steps:
1) First, calculate the mean for the given sample data.
2) Next, use the CONFIDENCE() to calculate the confidence value based on the given significance level, standard deviation, and sample size.
3) Finally, deduct the CONFIDENCE() output from the sample mean to obtain the lower limit of the confidence interval. And add the CONFIDENCE() output to the sample mean to obtain the upper limit of the confidence interval.
The confidence interval function is not working in Excel, perhaps due to the following reasons:
• You supplied a non-numeric argument value to the CONFIDENCE().
• The alpha argument value is less than or equal to 0 or greater than or equal to 1.
• The standard_dev argument value isless than or equal to 0.
• The size argument value is less than 1.
Use this Confidence Interval In Excel Template to follow along with the examples in this article.
Download Excel Template