What is GROUPBY Function in Power BI?
The Group By function in Power BI is a part of the DAX (Data Analysis Expressions) language. It’s used to group and aggregate data in a table or dataset. Power Bi GROUPBY function allows you to create summary tables by specifying one or more columns to GROUPBY and defining aggregations for other columns within each group. It’s beneficial for creating calculated tables that provide a summarized view of your data. Using Power BI GROUPBY, you can perform multiple aggregations in a single table scan and then store the results in a Power BI table.
The syntax of the GROUPBY function is as follows:

GROUPBY (Table, [GroupBy_ColumnName1], …, [Name1], [Expression1], …)
- Table – refers to a DAX expression or table to be referred.
- GroupBy_ColumnName1 – refers to an existing column in the table to be grouped.
- Name1 – refers to the Name of the column to be added to the list of GroupBy_ColumnName1
- Expression1 – refers to the DAX expression to be evaluated. The first argument has to be CURRENTGROUP() used with a set of supported aggregated functions such as AVERAGEX, COUNTAX, COUNTX, GEOMEANX, MAXX, MINX, PRODUCTX, STDEVX.S, STDEVX.P, SUMX, VARX.S, VARX.P
Table of contents
Key Takeaways
- The GroupBy function in Power BI allows you to group data by one or more columns and perform aggregations within those groups.
- It’s a powerful tool for creating summarized views and calculated tables in your data model.
- While using the GroupBy function, consider the performance implications and choose appropriate aggregation functions.
- DAX expertise is essential for effectively utilizing the GroupBy function and other DAX capabilities in Power BI.
📊 Unlock Advanced DAX Skills in Power BI!
Take your Power BI skills to the next level with our Advanced DAX in Power BI Training Course. Dive deep into advanced DAX functions, complex calculations, and optimization techniques to enhance your data analysis and reporting capabilities.
How to Use GROUPBY DAX Function in Power BI?
The GROUPBY function creates a summary input table grouped by the columns specified in the DAX formula. It works similarly to the SUMMARIZE function but doesn’t perform any implicit CALCULATE for any additional columns you specify. To use the Power BI GROUPBY function, you must use the CURRENTGROUP function to perform any aggregations on the extended columns. The CURRENTGROUP function doesn’t take any argument, and you can only use this function with a set of aggregated functions as a first argument/parameter to those functions.
It returns a set of rows from the table argument of GROUPBY that belong to the current row of the GROUPBY result. The list of aggregation functions includes AVERAGEX, COUNTAX, COUNTX, GEOMEANX, MAXX, MINX, PRODUCTX, STDEVX.S, STDEVX.P, SUMX, VARX.S, VARX.P.
To use the GROUPBY function in Power BI, follow these steps:
Step 1: Import and Load your data into Power BI using a data connection.
Step 2: Navigate to the Modeling tab and click on the New table option in the top menu to create a measure for the dataset.
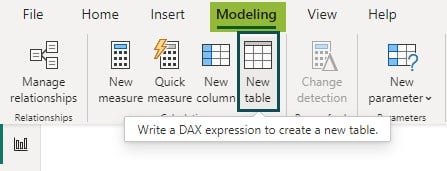
Step 3: Write the SUMX function in the formula bar using the Power BI Groupby sum.
GroupBy Student Measure = GROUPBY(Student_Marks,Student_Marks[Student_ID], “Total Marks by a Student”,SUMX(CURRENTGROUP(), Student_Marks[Test_1]+Student_Marks[Test_2]+Student_Marks[Test_3]+Student_Marks[Test_4]+Student_Marks[Test_5]+Student_Marks[Test_6]+Student_Marks[Test_7]+Student_Marks[Test_8]+Student_Marks[Test_9]+Student_Marks[Test_10]+Student_Marks[Test_11]+Student_Marks[Test_12])

Step 4: Click on the Commit icon (√) to create the measure and use it in your visualization.

Step 5: Navigate to the Data View tab to view the data of the newly created table
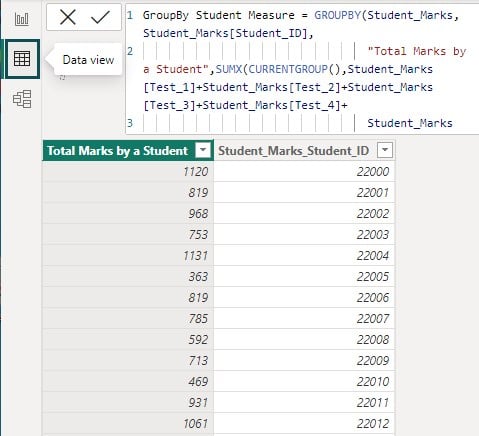
You can perform Power BI GROUPBY SUM, with Filter, Count, and Measure as per your reporting requirement for data visualization.
In the subsequent section, we will go through some of the examples to understand how you can use the GROUPBY function in Power BI to create tables and use them for your data visualization requirements.
Examples
In this section, we will see two examples where we will provide a step-by-step process to create and use GROUPBY in Power BI.
Example #1
In this example, we will create a Power BI table where we will aggregate the dataset to store the Total Revenue, Total Cost, and Total Discounts per product, segment across all years using the Financials dataset in Power BI. To use the Power BI GROUPBY function, follow these steps:
Step 1: Open the Power BI Desktop and import the Financials dataset using Data Connection. To load the dataset to Power BI, click on the Load button.
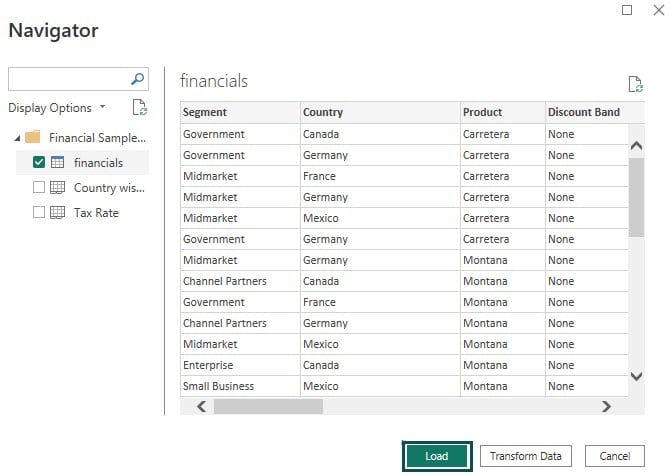
Once imported into Power BI, you will be able to view the data fields in the Fields pane.

Step 2: Navigate to the Modeling tab and choose the New table option.

Once you choose the New table option, you will see a prompt in the formula bar.
Step 3: Enter the Power BI DAX expressions in the formula bar to create the Power BI GROUPBY table on the Financials table.
We have created a GroupBy Year, Product & Segment table that aggregates per Year, Product, and Segment using the Power BI Groupby sum function in Power BI DAX.

GroupBy Year, Product & Segment GROUPBY(financials,financials[Year],financials[Product],financials[Segment],”Total Revenue”,SUMX(CURRENTGROUP(), SUM(financials[Units Sold])*SUM(financials[Sale Price])), “Total Cost”,SUMX(CURRENTGROUP(), SUM(financials[COGS])), “Total Discounts”,SUMX(CURRENTGROUP(), SUM(financials[Discounts])))
Step 4: Click on the Commit icon to save the changes for each of the above changes to create the new table.

Step 5: Navigate to the Data view tab and choose the table in the Fields pane to view the dataset.
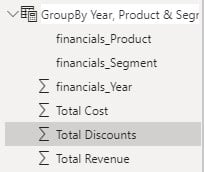
The dataset in the GroupBy Year, Product & Segment table is visible below.
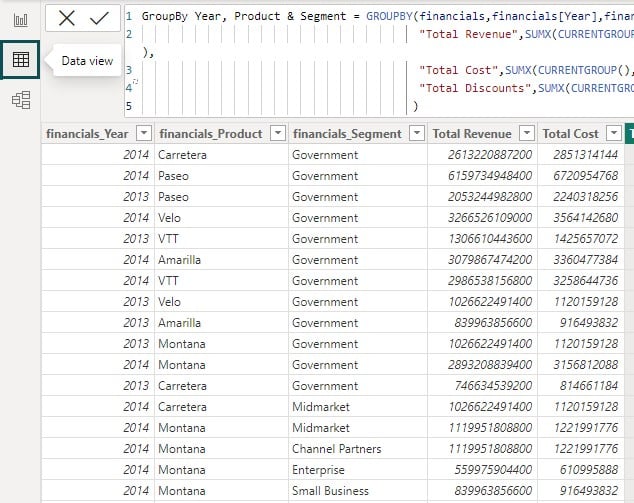
As you can see, we have created an aggregated table using the GROUPBY function in Power BI, and you can use the data for your analysis.
Example #2
In this example, we will store the aggregated data set, such as Total Area, Total Land Area in the Power BI table using the countries-table dataset. We will use the GROUPBY function in Power BI to create the Power BI table. To use the Power BI GROUPBY function, follow these steps:
Step 1: Open the Power BI Desktop and import the countries-table file using Data Connection. To load the dataset to Power BI, click on the Load button.

Once imported to Power BI successfully, you can see the data attributes in the Fields pane.
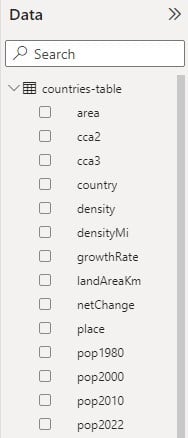
Step 2: Navigate to the Modeling tab and choose the New table option.

Once you choose the New table option, you will see a prompt in the formula bar.
Step 3: Enter the DAX expressions in the formula bar to create the Power BI GROUPBY table on the Financials table.
We have created a GroupBy countries table using the Power BI GROUPBY sum function in Power BI DAX.

Step 4: Click on the Commit icon to save the changes for each of the above changes to create new measures.

Step 5: Navigate to the Data view tab and choose the table in the Fields pane to view the dataset.
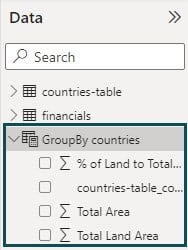
The dataset in the GroupBy countries table is visible below.
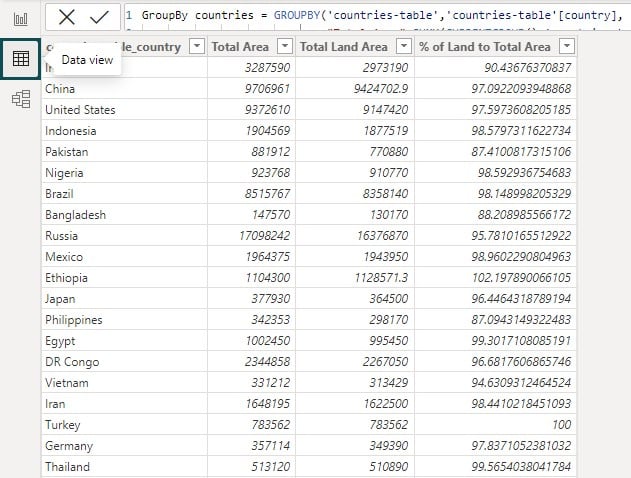
As you have noticed, using the GROUPBY function, we have created an aggregated table that can be used for data visualization and reporting.
Note: You can also use the Power BI Groupby measure, with filter, and with count for further calculation and aggregation in the Power BI table.
For example: Here, we have created a Power BI Groupby with filter where we applied a filter on the country name to create the Power BI table.
Groupby Countries with filter = GROUPBY(FILTER(‘countries-table’, ‘countries-table'[country] = “United States”),’countries-table'[country],”Total Area”,SUMX(CURRENTGROUP(),’countries-table'[area]), “Total Land Area”,SUMX(CURRENTGROUP(),’countries-table'[landAreaKm]),% of Land to Total Area”,SUMX(CURRENTGROUP(),(‘countries-table'[landAreaKm]/’countries-table'[area])*100) )

The below DAX expression acts as a table that filters out records specific to the United States
FILTER(‘countries-table’, ‘countries-table'[country] = “United States”)
Important Things to Note
- The GroupBy function creates a table with grouped results. It doesn’t directly modify your existing data table but generates a new table.
- Based on your analysis requirements, use appropriate aggregation functions like AVERAGEX, SUMX, COUNTX, MINX, MAXX, etc.
- For every column in the GroupBy function for which you define a name, you must specify an expression; otherwise Power BI will return an error.
- The name defined in the GroupBy function should be enclosed in double quotation marks.
- Ensure that you use CURRENTGROUP() function as the first argument to the aggregation function while using the GroupBy function.
- GroupBy can be resource-intensive for large datasets, so use it judiciously and consider optimizing your data model for better performance.
- You can use the GroupBy function along with other DAX functions to perform more complex calculations and filtering within each group.
- You can’t use the GroupBy function for use in DirectQuery mode for use in calculated columns or row-level security rules.

Frequently Asked Questions (FAQs)
In Power BI, both GROUPBY and “Summarize,” are operations used to aggregate and manipulate data, but they serve slightly different purposes.
There can be several reasons why GROUPBY in Power BI may not work. Some of the common problems and their possible remedial measures include:
• Ensure that the columns you use for grouping have appropriate data types. Grouping may only work as expected if the data types are compatible.
• Check for missing or inconsistent data in the columns you try to group by. If there are null or empty values, it might impact the grouping results.
• If you are using Power Query to shape and transform your data, steps might be affecting the grouping operation. Review your applied steps to see if any of them are altering the data in a way that affects grouping.
• If you’re trying to group by a combination of columns, ensure that you’re selecting the correct columns in the GROUPBY dialog box.
GROUPBY in Power BI is crucial for creating summarized views of your data. It helps you organize data into meaningful categories and calculate aggregations within those categories. It is particularly useful when creating reports or visualizations that display high-level insights without overwhelming the viewer with raw data. By grouping data and performing aggregations, you can quickly understand your data’s patterns, trends, and comparisons.
Recommended Articles
This has been a guide to Power BI GroupBy. Here we look how to use GroupBy DAX function in Power BI to create tables for data visualization with examples. You can learn more from the following articles –

Leave a Reply