


Introduction to Power BI Performance Analyzer with Copilot
Many finance and BI teams struggle with laggy Power BI reports that refresh slowly or stutter when users interact with filters and slicers. The usual approach is to trial‑and‑error tweaks-removing visuals, slimming down tables, or tweaking relationships. There is no clear visibility into which query or DAX measure is actually to blame. Power BI Performance Analyzer Copilot query optimization changes that by combining the built‑in Performance Analyzer tool with AI‑driven suggestions from Copilot to pinpoint slow steps and propose more efficient alternatives.
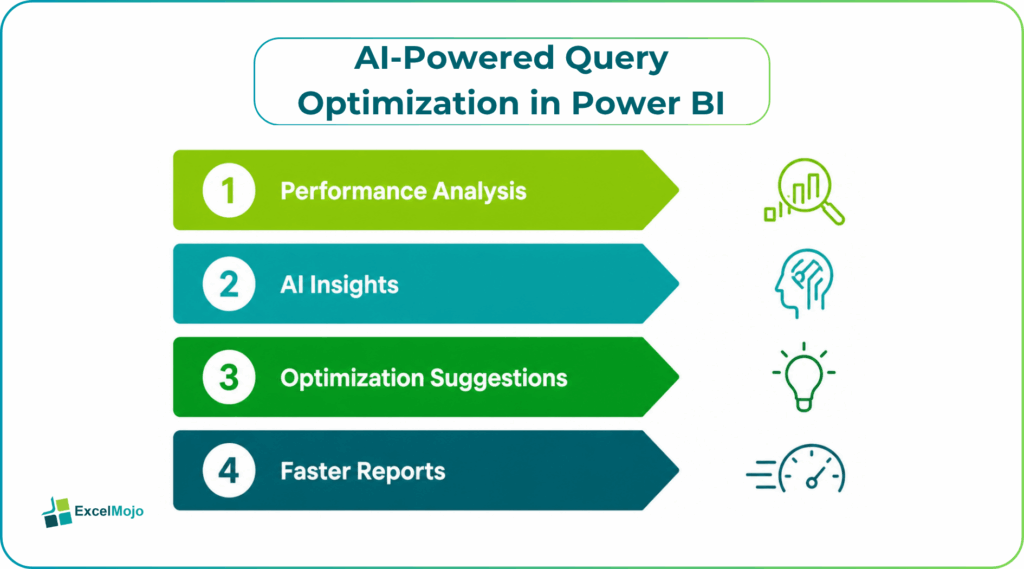
This fits under AI query optimization in Power BI Performance Analyzer, where Copilot interprets the diagnostics data and suggests concrete changes such as simplifying DAX, pushing logic into the source query, or re‑structuring the model. For analysts already using Measures, DirectQuery, or large fact tables, that means they can move from guessing where the bottleneck lives to focusing on the specific calculations that are adding seconds to refresh time. The Performance Analyzer tool records the sequence of operations performed when a visual is updated, which is critical for isolating expensive queries and tuning them systematically .
How Power BI Performance Analyzer Works
Power BI Performance Analyzer is a built-in diagnostic tool designed to show what happens behind the scenes when a visual redraws or a slicer is clicked.
To use it:
- Open the report in Edit mode.
- Click the Performance Analyzer button under the View tab.
- In the panel, click Start Recording, interact with the problematic visual or filter, then click Stop Recording.
The panel then displays a table with entries such as:
- Visual name
- Query (DAX or M step)
- Duration ms (how long the step took)
- Evaluation timing and dependencies
Performance Analyzer is a way to capture the sequence of operations that occur when a visual is updated, including both DAX query‑engine and storage‑engine activity. For Power BI’s Performance Analyzer, that list of steps becomes the raw input for AI‑assisted optimization: each row represents a candidate for simplification, restructuring, or offloading to the source query.
How to Combine Performance Analyzer with Copilot
Power BI Performance Analyzer with Copilot becomes most valuable when the analyst feeds the recorded diagnostics into a natural‑language prompt so Copilot can suggest concrete tuning actions.
A typical workflow for Power BI Performance Analyzer with Copilot:
- Run Performance Analyzer on a slow page and export the recorded table (for example, copy‑paste the rows into a sheet or a note).
- Open the Copilot or “Ask Copilot” experience in Power BI or in a companion tool such as GitHub Copilot or a code‑assistant pane.
- Ask a question like:
- “Which of these visuals has the longest Duration ms and how can I rewrite the DAX to improve it?”
- Or: “The ‘Revenue by Region’ visual takes over 1.5 seconds; here are the DAX formulas. Suggest a simpler version that pre‑aggregates by month.”
Copilot reads the exported data and measure definitions, then proposes changes such as:
- Replacing nested CALCULATE and FILTER calls with pre‑aggregated tables or disconnected dimensions.
- Moving complex logic from the visual level into a calculated column or summarized table at model load time.
- Pushing filters and aggregations down to the source query to reduce the amount of data loaded into Power BI.
This pattern is consistent with how AI is positioned as a “second mind” over the DAX and model logic. This helps analysts connect raw diagnostics to refactor strategies rather than leaving them to guess what to tweak.
Practical Example: Tuning a Slow Revenue Visual
Power BI Performance Analyzer with Copilot – A common scenario for Copilot query optimization Power BI Performance Analyzer is a revenue‑by‑region chart that freezes the report for several seconds every time the date slicer changes.
Suppose the Performance Analyzer log shows a visual named “Revenue by Region” with a Duration ms of 1800 and a DAX measure like:
Revenue By Region =
CALCULATE(
SUM(Sales[Revenue]),
FILTER(
ALL(Sales),
Sales[Region] = SELECTEDVALUE(Region[RegionName])
&& Sales[Year] = YEAR(TODAY())
)
)
A Copilot‑assisted workflow might yield a suggestion such as:
- Pre‑aggregate the data by Region and Year in the model, using a Summarized table or a Calculated table, and then reference that table in the measure.
- Replace the FILTER(ALL(…)) logic with a simpler SUM over the pre‑aggregated table tied to the Region and Date tables.
For example:
Revenue By Region Optimized =
CALCULATE(
SUM(RevenueAgg[Revenue]),
RevenueAgg[Year] = YEAR(TODAY())
)
This small change can dramatically reduce the DAX complexity and allow the engine to resolve the visual faster. This is what AI query optimization in Power BI Performance Analyzer aims to surface via diagnostic‑driven suggestions.
Pitfalls and Best‑Practice Tips
Power BI Performance Analyzer Copilot query optimization is powerful but not a magic‑bullet solution. Analysts should keep a few key constraints and best practices in mind.
One common issue is over‑optimizing early. Teams sometimes rewrite every DAX measure aggressively, which can make the model harder to maintain and test. Best practice is to tune only the top‑few offenders identified by Performance Analyzer and then validate the business logic after each change.
Another risk is mis‑balancing vertical vs horizontal scalability. Copilot might suggest pushing heavy aggregations into the model, which helps with query speed but can increase file size and refresh time at load. Analysts must balance in‑model computation with pre‑aggregation in the source (for example, in SQL or Power Query) and test with real‑size fact‑table volumes.
A third pitfall in Power BI Performance Analyzer with Copilot is governance and documentation. AI‑suggested DAX often lacks comments or business‑rule context. Teams should treat Copilot‑generated code as a first draft, adding clear comments, unit tests, and performance benchmarks before promoting it into production workspaces.
Frequently Asked Questions (FAQs)
Copilot cannot automatically edit the model or DAX once the Performance Analyzer is running, but it can interpret the exported diagnostic data and suggest specific DAX or model changes. The analyst must still apply those changes manually and validate the results.
The optimization logic can originate from Copilot‑style tools outside Power BI as well; the core requirement is that Copilot can read the DAX and Performance Analyzer logs. Whether the assistant is built‑in or from a separate coding environment, the workflow remains similar: diagnose, export, prompt, then refactor.
Copilot generally proposes sensible optimizations such as simplifying filters, re‑using existing measures, and pre‑aggregating tables, but the accuracy depends on how well the model is documented and how clearly the business logic is described. Analysts should always validate the suggested measures against known test cases.
Yes, Performance Analyzer still captures query‑engine timings for DirectQuery and live connections, and Copilot can help refactor DAX or suggest pushing more logic into the source SQL or model. However, for DirectQuery, the ultimate bottleneck may lie in the source database, so the analyst must coordinate with DBAs and test with realistic query plans.
Recommended Articles
Continue with these related resources when you want the next practical step in this topic.
- Power BI Tutorial
- Getting Started with Power BI
- Power BI Features
- Power BI Desktop Installation
- Data Types in Power BI
Explore the full Power BI Basics and Comparisons guide or browse Power BI Resources.