


Introduction
Excel dashboards often look polished, but many still behave like static reports. Users can filter PivotTables and slicers, yet clicking a chart usually does nothing. That is where VBA Chart Events ChatGPT interactive dashboard controls become valuable. By combining Excel chart events with AI-generated VBA, analysts can turn ordinary charts into clickable controls that filter data, update KPIs, and reveal transaction-level detail. For finance teams, this means less time navigating worksheets and more time interpreting results.
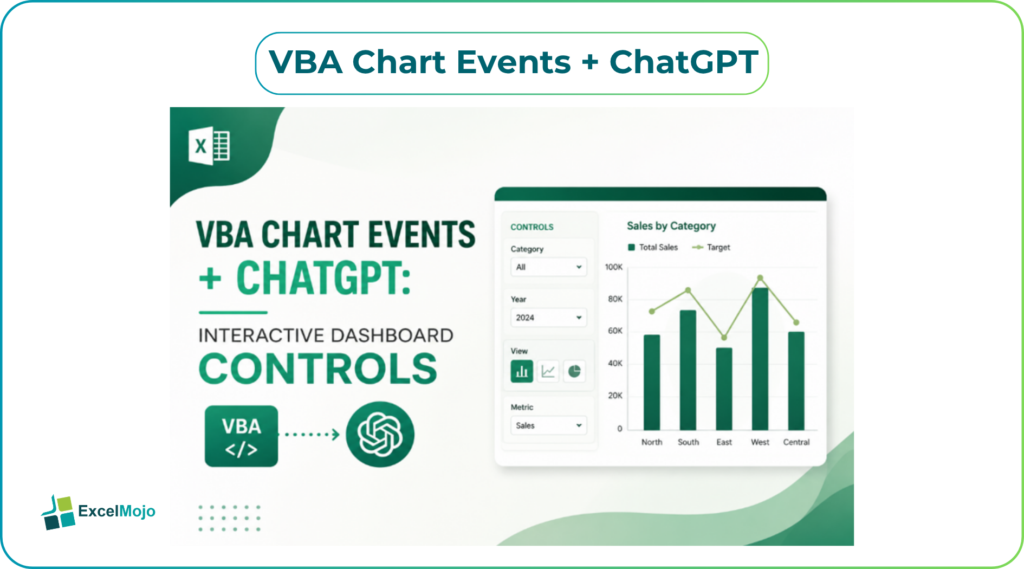
This article walks through how to use VBA chart events such as Chart_Select and Chart_BeforeDoubleClick to build interactive dashboard controls in Excel. It also shows how ChatGPT can generate much of the underlying VBA code, helping analysts add drill-down functionality and custom actions without writing every line manually.
How VBA Chart Events Turn Static Charts Into Interactive Controls
Excel chart events are VBA procedures that run when a user interacts with a chart. They can detect when a chart element is selected, double-clicked, or right-clicked.
For example, if a user clicks the “North Region” bar in a revenue chart, VBA can capture that selection and use it to refresh formulas, update PivotTables, or open a supporting detail sheet. This is what makes interactive dashboard controls VBA chart events so useful in financial models.
Setting Up a Simple Chart_Select Event
The Chart_Select event runs whenever a user selects part of a chart. It returns information about the selected series and data point.
Private Sub Chart_Select(ByVal ElementID As Long, _
ByVal Arg1 As Long, _
ByVal Arg2 As Long)
If ElementID = xlSeries Then
MsgBox “Series: ” & Arg1 & vbCrLf & _
“Point: ” & Arg2
End If
End Sub
When a user clicks a data point, Excel identifies exactly which series and point were selected. That information can be linked to worksheet logic to create drill-down dashboards.
How ChatGPT Speeds Up VBA Development
Writing event-driven VBA can be time-consuming, especially when embedded charts require class modules and WithEvents declarations.
ChatGPT simplifies the process. A prompt such as “Write VBA code that updates cell B2 with the selected chart category” can generate usable code in seconds. This makes VBA Chart Events with ChatGPT controls practical even for users who do not write VBA every day.
Practical Example: Click a Chart Bar to Filter a Dashboard
Imagine a dashboard that tracks revenue by region.When the CFO clicks the “South” bar, VBA writes “South” to a control cell, refreshes PivotTables, and updates KPI cards automatically. The interaction feels intuitive because the chart itself becomes the filter.
Sheets(“Dashboard”).Range(“B2”).Value = RegionName
ThisWorkbook.RefreshAll
This approach reduces the need for drop-down menus and allows executives to explore data directly during meetings.
Using Chart_BeforeDoubleClick for Advanced Actions
The Chart_BeforeDoubleClick event runs before Excel performs its default double-click behavior.
It is often used to reset filters, open detail sheets, or prevent users from accidentally entering chart formatting mode. For example, a double-click can clear the selected region and restore the full dashboard view.
Private Sub Chart_BeforeDoubleClick( _
ByVal ElementID As Long, _
ByVal Arg1 As Long, _
ByVal Arg2 As Long, _
Cancel As Boolean)
Cancel = True
Sheets(“Dashboard”).Range(“B2”).ClearContents
ThisWorkbook.RefreshAll
End Sub
Best Practices for Finance Dashboards
- Use a Dedicated Control Cell: Store the selected category or time period in one worksheet cell. This makes formulas and PivotTables easier to manage.
- Build with Named Ranges: Named ranges improve readability and reduce hard-coded references.
- Add Error Handling: Users may click titles, legends, or empty chart areas. Code should ignore unsupported selections.
- Limit Refresh Frequency: Refreshing a large model after every click may slow performance.
- Document Dashboard Logic: A Notes sheet helps others understand how chart selections drive calculations.
Common Pitfalls and How to Avoid Them
- Embedded Charts Need Class Modules: Chart events for embedded charts do not work in standard modules. They must be assigned to a class module using WithEvents.
- Ignoring ElementID Checks: Users can click titles, legends, and plot areas. Code should confirm the click occurred on a data series before running any logic.
- Protected Worksheets: If the target control cell is locked, the macro may fail. Keep input cells unlocked or temporarily unprotect the sheet.
- Slow Workbook Refreshes: Running RefreshAll after every click can be inefficient. Refresh only the objects that depend on the selected value.
- Macro Security Restrictions: If macros are disabled, chart events will not run. Save the file as .xlsm and use a trusted location.
VBA Chart Events vs Slicers
| Feature | VBA Chart Events | Excel Slicers |
|---|---|---|
| Click directly on chart | Yes | No |
| Custom logic | Yes | Limited |
| Open forms or sheets | Yes | No |
| Requires VBA | Yes | No |
| Highly flexible | Yes | Moderate |
Slicers are convenient for quick filtering, but ChatGPT powered VBA chart interaction allows much more customized behavior.
Conclusion
VBA Chart Events ChatGPT interactive dashboard controls help transform Excel from a static reporting tool into an interactive analytical application.
For finance professionals, clickable charts can speed up reviews, simplify drill-down analysis, and reduce navigation time. With ChatGPT generating much of the VBA code, advanced dashboard interactivity is easier to implement than ever.
Frequently Asked Questions (FAQs)
What is the Chart_Select event in VBA?
The Chart_Select event runs whenever a chart element is selected. It provides the element type, series index, and point index so VBA can identify exactly what the user clicked.
Can ChatGPT generate VBA code for chart events?
Yes. Users can describe the desired behavior in plain English, and ChatGPT can generate code for events such as Chart_Select and Chart_BeforeDoubleClick.
Do embedded charts support events?
Yes, but they require a class module with a WithEvents declaration. Standard modules alone cannot capture embedded chart events.
Are VBA chart events better than slicers?
Slicers are simpler to set up, but chart events offer greater flexibility. They can trigger custom macros, update worksheets, and open detailed reports.