What is Power BI VLOOKUP?
Power BI VLOOKUP is a concept that refers to the process of looking up a value in a table or dataset based on a specific condition and returning a corresponding value from another column. It is similar to the VLOOKUP function in Excel. However, unlike Excel, no in-built function such as Power BI VLOOKUP exists. You achieve VLOOKUP functionality in Power BI using DAX functions like LOOKUPVALUE or by utilizing relationships and measures to perform similar tasks.
Table of contents
Key Takeaways
- Power BI doesn’t support direct VLOOKUP DAX. However, you can implement similar functionality using alternative DAX functions like Excel.
- LOOKUPVALUE in DAX works similarly to VLOOKUP but is more versatile with more complex filtering capabilities. You can perform VLOOKUP in Power BI from another table or the same table using the LOOKUPVALUE in DAX.
- You can also perform VLOOKUP in Power BI Query Editor using Merge functionality for data manipulation.
- Understand relationships between tables to perform efficient lookups.
- While VLOOKUP in Excel is straightforward, replicating its behavior in Power BI may involve learning DAX and understanding the Power BI data model.
📊 Unlock Advanced DAX Skills in Power BI!
Take your Power BI skills to the next level with our Advanced DAX in Power BI Training Course. Dive deep into advanced DAX functions, complex calculations, and optimization techniques to enhance your data analysis and reporting capabilities.
How to VLOOKUP in Power BI?
To achieve a VLOOKUP in Power BI, use the LOOKUPVALUE function or create calculated columns and measures using DAX. This will result in Excel-like functionality in Power BI.
The LOOKUPVALUE function retrieves a value for the row that meets all the conditions specified in a search condition similar to VLOOKUP in Power BI DAX. The syntax for the LOOKUPVALUE function is
LOOKUPVALUE (Result_ColumnName, Search_ColumnName1, Search_Value1, …, [Alternate_Result])

It has the below parameters:
- Result_ColumnName – The existing column name containing the value to be returned, and it must not be an expression
- Search_ColumnName1 – The existing column name to be searched. This column can be present in the same table as Result_ColumnName or in a related table. It must not be an expression.
- Search_Value1 – This is the value to be searched in Search_ColumnName1
The function searches for the search value <Search_Value1> in the search column.
<Search_ColumnName1> and returns the corresponding value from the result column <Result_ColumnName> when there is an exact match. If no match is found, it returns BLANK or <Alternate_Result> (if defined) is returned. If the dataset contains multiple rows for the search value <Search_Value1>, a single value is returned where the result column <Result_ColumnName> is identical. Otherwise, it may return a different value, <Alternate_Result> (if defined), or even an error.
In the next section, we will cover how to use VLOOKUP in Power BI.
Examples to use VLOOKUP in Power BI
There are multiple ways to use VLOOKUP in Power BI. You can use VLOOKUP in Power BI from another table or VLOOKUP in Power BI same table or VLOOKUP in Power BI Query Editor. Let us go through some of the examples encompassing these methods to understand how you can use the VLOOKUP in Power BI.
Example #1
In this example, we will learn how to use VLOOK in Power BI from another table. We have used the Segment Product Sales dataset for illustration purposes, which contains two different datasets.
- Product Sales – Product Sales data contains sales data across countries, segments, and product categories.
- Product Discount Band – It contains Discount Band and associated Discount Percentages
To use the VLOOKUP in Power BI from another table, follow the steps below:
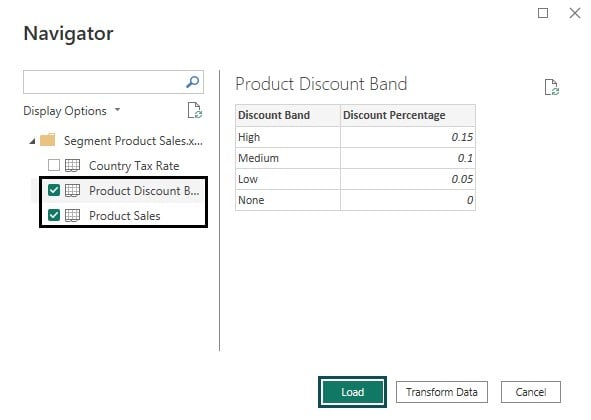
Step 1: Import the Product Sales and Product Discount Band datasets to Power BI using Data Connection. Click on the Load button to load the dataset to Power BI Desktop.
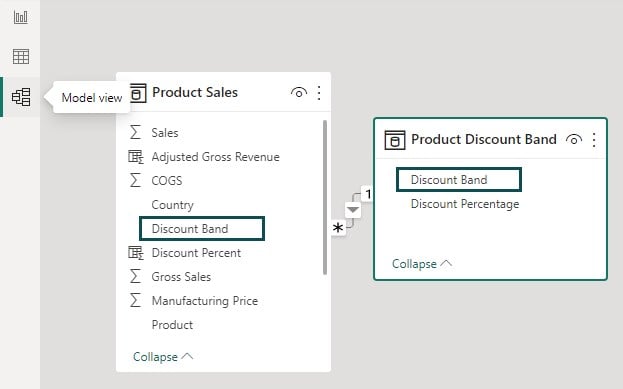
Once the data load is successful, you can view the relationship between Product Sales and Product Discount Band tables in the Model view tab.
Step 2:
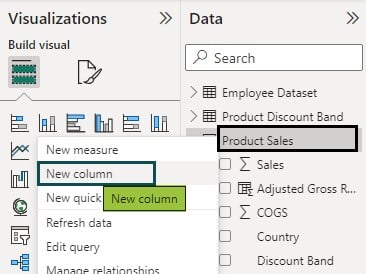
- Navigate to the Fields pane.
- Right-click on the Product Sales table.
- Select the New column option from the menu to create a new column.
Step 3: Enter the DAX expression in the formula bar for the Discount Percent column in the Product Sales table.
The syntax of this DAX expression is as follows:
Discount Percent = LOOKUPVALUE(‘Product Discount Band'[Discount Percentage],’Product Discount Band'[Discount Band],’Product Sales'[Discount Band])

Step 4: Once the DAX expression is created, click on the Commit icon to save the changes.
Step 5: Select the Format to Percentage to represent the column in percentage values.

Step 6: Now navigate to the Data view tab to view the data in the new column, i.e., Discount Percent.

Step 7:
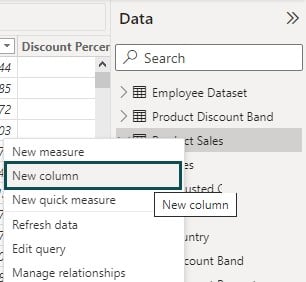
- Navigate to the Fields pane.
- Right-click on the Product Sales table.
- Select New column to create a new column.
Step 8: Enter the DAX expression in the formula bar for the Adjusted Gross Revenue column in the Product Sales table.
The syntax of this DAX expression is as follows:
Adjusted Gross Revenue = ‘Product Sales'[Sale Price]*(1-‘Product Sales'[Discount Percent])*’Product Sales'[Units Sold]

Step 9: Once the DAX expression is created, click the Commit icon to save the changes.
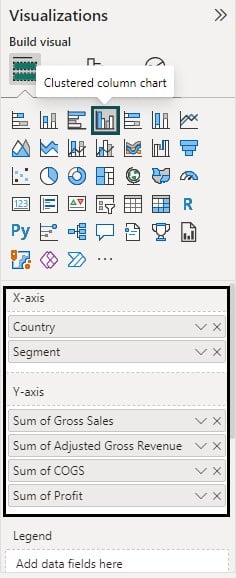
Step 10: Navigate to Visualizations pane, choose the Clustered column excel chart visual and drag and drop the appropriate fields from the Fields pane.
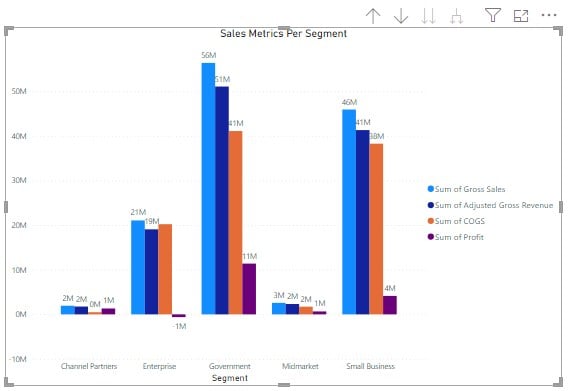
Step 11: Apply the formatting to the visual. Once the visual is created, you can see the report.
Example #2
This example will teach us how to use VLOOKUP in Power BI from the same table. For illustration, we have used Employee Dataset containing employee details and their manager id.
To use the VLOOKUP in Power BI from the same table, follow the steps below:
Step 1: Import the Employee Datasets to Power BI using Data Connection. Click on the Load button to load the dataset to Power BI Desktop.
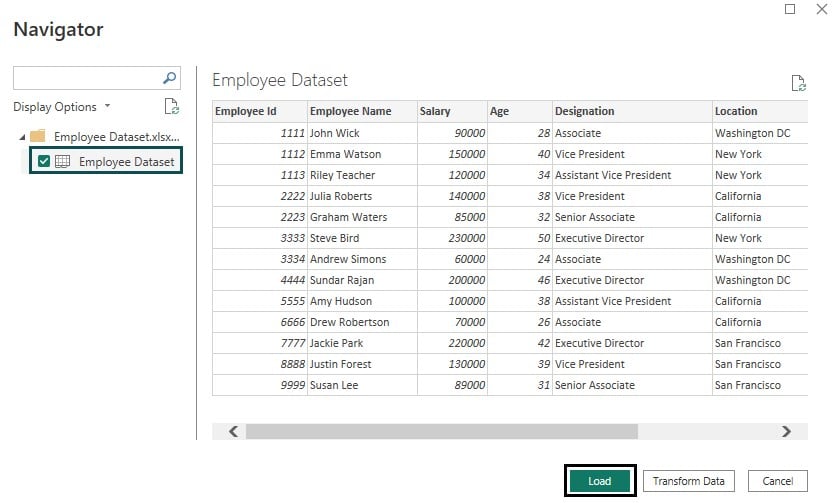
Step 2: Once the load is complete, navigate to the Fields pane to view the data attributes.

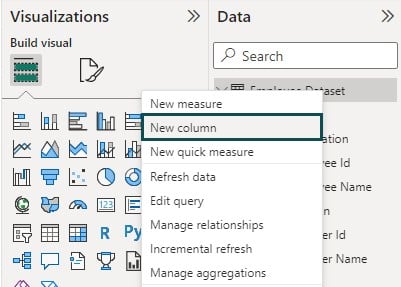
Step 3: Right-click on the Employee Dataset, select the New column from the menu to create a new column.
Step 4: Enter the DAX expression in the formula bar for the Manager Name column in the Employee Dataset table.
The syntax of this DAX expression is as follows:
Manager Name = IF(ISBLANK(‘Employee Dataset'[Manager Id]),””,LOOKUPVALUE(‘Employee Dataset'[Employee Name],’Employee Dataset'[Employee Id],’Employee Dataset'[Manager Id]))

Step 5: Navigate to the Data view to see the data for the Manager Name column.
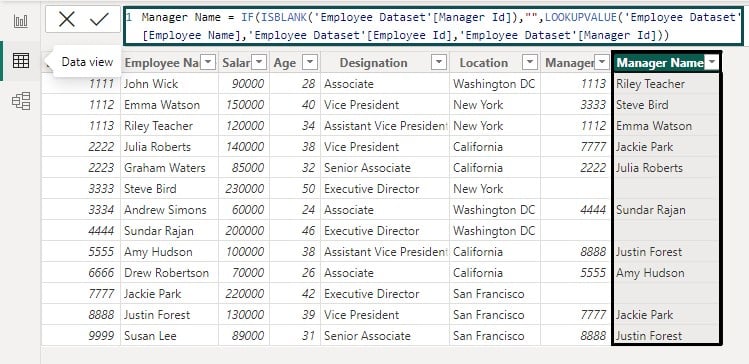
Step 6: Navigate to the Visualizations pane, choose Table Visual, and drag and drop the data fields from the Fields pane to create a visual, as shown below.

In the next section, we will learn how to replicate VLOOKUP in Power BI.
How to Replicate VLOOKUP in Power BI?
You can replicate the VLOOKUP function in Power BI using DAX functions such as LOOKUPVALUE. It allows you to retrieve values from a table based on specific conditions. The Power BI LOOKUPVALUE from another table will work regardless of if there exists any relationship between the source and target table.
Additionally, you can use relationships between tables and measures to achieve similar results. It is recommended that we use RELATED instead of the Power BI LOOKUPVALUE function. The RELATED function in Power BI examines all the values in the specified table irrespective of whether any filters have been applied or not and then performs a VLOOKUP.
The syntax of the RELATED function is as follows:
RELATED(<column>)

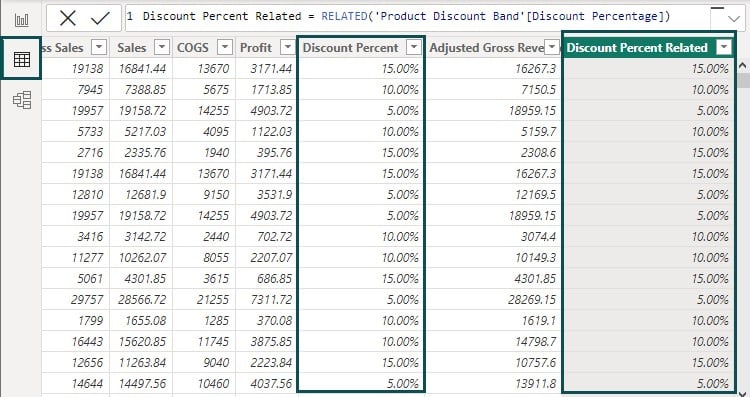
To use the RELATED function in Power BI, you can use the below DAX expression as shown below:

As you can see, values in Discount Percent and Discount Percent Related columns are the same. However, RELATED is fast, and efficient and requires a rela tionship to be present for a DAX.
Alternative Way of Fetching the Data in Power BI
An alternative way to fetch data in Power BI is through VLOOKUP in Power BI Query Editor, which allows you to transform and shape data before loading it into Power BI. VLOOKUP in Power BI Query Editor offers a wide range of transformation functions and options to clean, merge, and manipulate data from various sources. To apply VLOOKUP in Power BI Query Editor, follow the steps below:
Step 1: Right-click on the Power BI table (Product Sales) and choose the Edit query option from the menu.
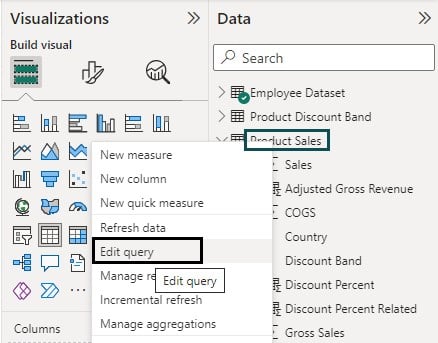
Step 2: In the Power BI Query Editor, navigate to the Home tab and choose the Merge Queries option.

Step 3: In the Merge pop-up window, specify the table and matching columns to create a merged table and click on OK.

Step 4: Select the matching columns from both tables and then click on the OK button.
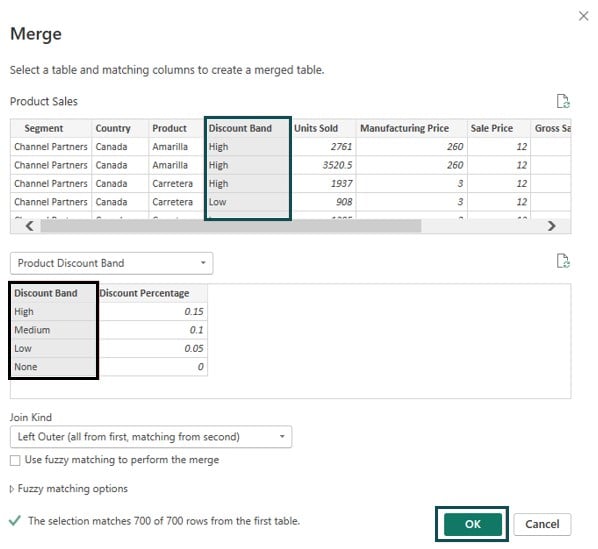
Using the steps above, you can use the VLOOKUP in Power BI Query Editor to merge columns in Power BI.
Important Things to Note
- There is no direct VLOOKUP in Power BI DAX like Excel. DAX functions and Power Query are used for data manipulation.
- LOOKUPVALUE requires a direct relationship between the search column and the result column. Alternatively, you can use the RELATED DAX function which is more efficient and faster compared to LOOKUPVALUE.
- Utilize relationships between tables in Power BI to perform context-aware lookups.

Frequently Asked Questions (FAQs)
In Power BI, you don’t use Excel functions like VLOOKUP or HLOOKUP directly. Instead, you can achieve similar functionalities using DAX (Data Analysis Expressions), which is a formula language specifically designed for Power BI and other Microsoft tools like Excel Power Pivot. The equivalent DAX function to VLOOKUP is typically the LOOKUPVALUE function, and there isn’t a direct equivalent to HLOOKUP since it’s more relevant to a tabular structure like Excel spreadsheets. LOOKUPVALUE function allows you to find a single value in a column within a table that matches specific conditions.
The syntax of the LOOKUPVALUE function is:
LOOKUPVALUE(Result_Column, Search_Column1, Search_Value1, [Search_Column2, Search_Value2, …])
Alternatively, you can also use the RELATED function.
The syntax of the RELATED function is as follows:
RELATED(<column>)
In Power BI, vertical and horizontal lookups aren’t as pronounced as in Excel due to the nature of tabular data models. Power BI’s primary focus is on columnar data. Instead of HLOOKUP, you often work with columns of data. However, you can use DAX functions like SUMX or AVERAGEX along with filtering to achieve similar effects as HLOOKUP when working with row-based calculations.
If your VLOOKUP equivalent (LOOKUPVALUE) is not working as expected in Power BI, there could be various reasons:
• Column Mismatch: Ensure that the columns you’re referring to the LOOKUPVALUE function that exists in the specified table.
• Search Values: Check that the search values provided match the data type of the columns being searched.
• Relationships: If you’re working with multiple tables, make sure the tables have appropriate relationships established.
• Filter Context: DAX calculations are influenced by filter context. Check if any filters are affecting the results of your LOOKUPVALUE function.
• Calculated Columns: Calculated columns in your table can influence the results. Ensure that any calculated columns are correctly defined.
If you encounter specific issues with a VLOOKUP equivalent in Power BI, refer to Microsoft Power BI documentation for more details and troubleshooting.
Recommended Articles
This has been a guide to VLOOKUP in Power BI. Here we learn how to use, replicate VLOOKUP in Power BI, Alternative ways, with examples. You can learn more from the following articles –

Leave a Reply