
Introduction
Excel dashboards have always been useful for tracking data. This year, we expect even more changes as there have been a lot of improvements in Excel with the advent of AI. Businesses want dashboards that update faster, handle large datasets, and clearly present insights without manual effort. This is where AI tools are changing the way dashboards are built. Instead of spending hours writing formulas and formatting charts, you can now use tools like ChatGPT to assist with design, logic, and structure.
ChatGPT can never be a replacement for the marvellous capabilities of Excel, but can enhance it in combination. You still build dashboards in Excel, but AI helps you generate formulas, fix errors, and improve layout decisions. This makes dashboard creation faster and more accessible, even for those who are not experts.
Why AI Dashboards Are in High Demand
Dashboards are used in almost every business function. Finance teams track revenue and expenses. Marketing teams analyze campaigns. Operations teams monitor performance metrics. The problem is that traditional dashboards take time to build and maintain. Every update requires manual effort. If the data changes, formulas and charts may need adjustments. AI reduces this workload. It helps automate repetitive tasks and improves accuracy. Instead of manually checking everything, you can rely on AI to assist with calculations and formatting.
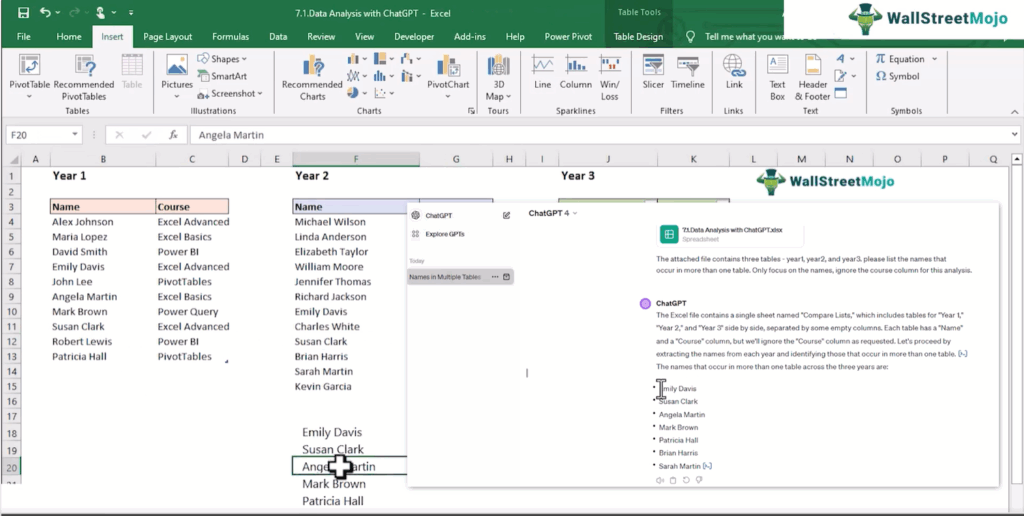
Video Screenshot: ChatGPT & AI For Microsoft Excel Course
Another reason for high demand is decision-making speed. Businesses want quick insights, not just data. AI-enhanced dashboards make it easier to interpret data and act on it. This is why professionals who can build AI-assisted dashboards are becoming more valuable.
Core Skills for Creating AI Dashboards
Building effective dashboards still requires strong Excel fundamentals. AI makes the process easier, but you need to understand how data flows and how dashboards are structured.
#1 – Data structuring and layout
A good dashboard starts with well-structured data. If the data is not organized properly, the dashboard will not work efficiently. You need to ensure that data is clean, consistent, and arranged in a logical format. This includes proper column naming, removing duplicates, and maintaining consistent data types.
Layout is equally important. A dashboard should be easy to read, with clear sections for key metrics. Users should be able to understand the data immediately without confusion. AI can help by suggesting layout improvements and identifying issues in the data structure. However, the basic understanding of organization still comes from the user.
#2 – Dynamic formulas and arrays
Modern dashboards rely heavily on dynamic formulas. Functions like lookups, conditional logic, and array formulas allow dashboards to update automatically when data changes. Instead of using static calculations, dynamic formulas adjust based on input data. This makes dashboards more flexible and scalable.

Video Screenshot: ChatGPT & AI For Microsoft Excel Course
AI tools can generate these formulas quickly. You can describe what you want, and ChatGPT can suggest the correct formula. This reduces errors and saves time, especially when working with complex calculations.
#3 – ChatGPT‑assisted dashboard design
Designing a dashboard is not just about charts. It involves choosing the right visuals, arranging them properly, and ensuring clarity. ChatGPT along with Excel, will assist by suggesting chart types, layout structures, and formula logic. It can be asked to perform tasks like comparing prices, checking trends, etc.
It can also help refine your dashboard by suggesting improvements in it. It can help you simplify formulas used for dashboards and make them more readable. AI-powered Excel finance dashboards automate data analysis, generate real-time insights, and use tools like ChatGPT to simplify complex financial reporting with minimal manual effort.
Using AI for Real‑Time Reporting
Real-time reporting is one of the biggest advantages of dashboards that have been improved with AI. Traditional dashboards often require manual updates, which can delay insights.
With dynamic formulas and structured data, AI Excel dashboard can update automatically as new data is added. AI helps ensure that formulas are set up correctly, so updates happen smoothly. ChatGPT can assist in building formulas that support real-time updates. It can also help troubleshoot issues when dashboards do not refresh as expected. This improves reliability and reduces the need for constant manual checks.
Landing Roles That Use Excel Dashboards
Excel dashboards are used in many roles, especially those that involve data analysis and reporting.
Some common roles include:
- Data analysts who create reports and visual insights
- Finance professionals tracking budgets and forecasts
- Marketing analysts monitoring campaign performance
- Business analysts evaluating performance metrics
- Operations teams managing daily reports
In these roles, dashboards are a key tool for decision-making. Being able to build and manage them efficiently is a valuable skill. ChatGPT Excel dashboards give professionals an advantage because they reduce manual work and improve accuracy.
Upskilling Through AI‑Excel Training
Learning how to build AI-enhanced dashboards may be time consuming. However, getting the right training that follows a definite structure can make it easier. Instead of figuring everything out on your own, you follow a clear path. Courses that combine Excel with AI focus on practical skills. They teach how to clean data, build ChatGPT Excel dashboards, and use AI tools effectively. For example, the ChatGPT & AI For Microsoft Excel Course covers how to use ChatGPT with Excel for tasks like formula generation, automation, and reporting. These courses often include templates and exercises. This helps you practice and apply what you learn immediately. With the right training, you can build job-ready skills faster.
Frequently Asked Questions (FAQs)
Excel is fully capable of building professional ChatGPT Excel dashboards. With features like charts, pivot tables, and slicers, you can create interactive and visually clear reports. AI tools make this even easier by helping with formulas and design decisions. While tools like Power BI are useful, Excel remains a strong option for many use cases.
ChatGPT helps by generating formulas, suggesting chart types, and explaining how to structure dashboards. It can also help debug errors and improve layout clarity. Instead of spending time searching for solutions, you can ask direct questions and get quick guidance. This speeds up the overall dashboard creation process.
Many AI-Excel courses include templates as part of their learning material. These templates help you understand how dashboards are structured and allow you to practice quickly. They also save time when building your own dashboards. Using templates is a practical way to learn and apply new skills.
Recommended Articles
Continue with these related resources when you want the next practical step in this topic.
- How To Use AI With Excel
- How AI Is Transforming Data Analysis In Excel (2026 Complete Guide)
- Excel AI And Machine Learning: Beginner’s Guide For 2026
- The Most Useful AI Features in Excel: Unlock Smarter Spreadsheets in 2026
- Top Skills for AI-Enabled Excel in 2026 (Must-Master List)
Explore the full Excel AI Automation and Analysis guide or browse Excel Resources.