


Introduction
Business teams often build rich Power BI dashboards, but many end users still struggle to build or modify visuals when they need a slightly different view of the data. They may know the metric they want, such as “total sales by region last quarter,”but not how to drag the right fields into the right visuals. Power BI AI Q&A natural language visuals helps bridge this gap by letting users type a plain‑language question and have Power BI automatically create a suitable chart, table, or card based on the underlying model. When combined with Power BI AI Q&A create visuals from text, this feature turns the report into a question‑and‑visual environment where people can explore data without touching the field‑drag‑and‑drop UI.
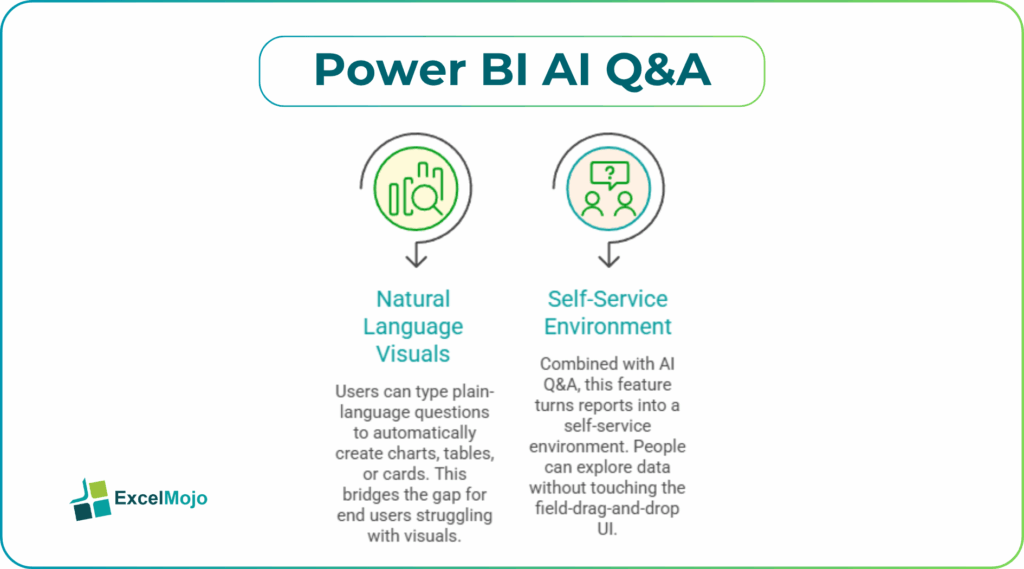
This article explains how to use natural language visual creation Power BI AI to build Q&A visual reports that respond to questions like “Show profit by month for the last 12 months” or “What are the top 5 products by sales?” It also shows how to fine-tune the resulting visuals. The Q&A visual is a way to ask natural‑language questions and have Power BI return the answer as a visual, which is the core idea behind generating visuals with natural language in Power BI. For mid‑level analysts and business users, that means faster, more intuitive exploration without switching between different chart‑building panels.
What the Q&A Visual Can Do
The Q&A visual in Power BI is an AI‑driven, interactive box where users ask questions in natural language. Power BI tries to interpret the request and display the answer as a visual. Supported data sources include datasets, semantic models, and reports that are already connected to the service.
Some common behaviors:
- When a user types something like “Show total sales by month,” Power BI may return a line chart grouped by month.
- When they enter “Top 5 products by sales,” Power BI might create a bar chart or table showing the top items.
- Users can also specify the visual type, such as “Show total sales by region as a map,” to guide the layout.
The underlying model must be reasonably well‑named and consistent, so that Power BI can map the words in the question (such as “sales,” “region,” or “month”) to the actual columns and measures in the model. This is the backbone of natural language visual creation Power BI AI and why clean, business‑friendly column names matter.
How to Add and use the Q&A Visual
Using Power BI AI Q&A natural language visuals follows a simple workflow that even mid‑level users can master quickly.
- In Power BI Desktop or the service, open the report where you want the Q&A visual.
- From the Visualizations pane, select Q&A (or AI Q&A in newer versions) and drop it onto the canvas.
- In the Q&A box that appears, type a question such as “Show profit by product category” or “What is the average revenue per customer by region?”
- Power BI will underline the recognized parts of the question and may offer autocompletion suggestions as you type.
- If the result is not what the user expected, they can rephrase the question slightly (for example, changing “show” to “which” or “what are”) and see how the visual changes.
This pattern is a practical example of Power BI AI Q&A create visuals from text and shows how a well‑phrased question can generate a ready‑to‑use visual in seconds.
How to Phrase Better Questions
Natural language visual creation Power BI AI works best when the questions are clear and use terms that match the model.
Useful patterns include:
- Focus on the measure and the dimension, such as “Show total sales by region” or “Number of orders by month.”
- Restrict the time scope, such as “Sales last year by quarter” or “Profit month‑to‑date by category.”
- Specify the visual type if needed, for example, “Show customer count by region as a map” or “Display revenue by month as a line chart.”
Avoid very vague or open‑ended questions such as “Tell me something interesting” because Power BI needs clear measure‑and‑dimension patterns to build a visual.
Practical Example: A Self‑Service Sales Report
A common use case is a sales dashboard where analysts want business users to explore the data without building custom charts. Using AI Power BI reports, the pattern becomes:
- Design a core dashboard with a few key visuals, such as a top‑level KPI card, a trend line chart, and a regional bar chart.
- Add a Q&A visual in the top‑right corner of the page and label it “Ask a question about sales” or similar.
- Train the business team to type questions like “Top 10 customers by revenue this year” or “Which category had the largest growth last month?”
- Let users experiment and then, if they like a specific visual, pin or convert it into a permanent chart on the page.
That workflow is a practical example of generate visuals with natural language in Power BI and demonstrates how the Q&A visual can turn a static dashboard into an interactive, self‑service exploration space.
Pitfalls and Best Practices
Power BI AI Q&A natural language visuals can speed up exploration but also introduces subtle issues.
One common issue is ambiguous terms. If the model has multiple columns with similar names, such as “Sales Amount” and “Sales Value,” the Q&A engine may guess wrong and create a chart that does not match the user’s intent. Best practice is to keep column and measure names consistent and business‑oriented, and where possible, set clear display folders and descriptions in the model.
Another risk is confusing visual choices. Power BI chooses the chart type automatically, so a simple question may return a map or a pie chart that is not ideal for the data. Analysts should encourage users to rephrase or append a visual type hint and then convert good patterns into standard visuals that stay on the page.
A third pitfall is over‑reliance on Q&A for Power BI AI Q&A Natural Language Visuals. The Q&A visual is excellent for ad‑hoc queries, but core KPIs and standard views should still live as fixed visuals so that governance and consistency are maintained.
Frequently Asked Questions (FAQs)
Power BI AI Q&A natural language visuals can replace some manual visual building, especially for ad‑hoc exploration and first‑draft views, but they should not fully replace planned, governance‑aligned visuals. Standard charts and tables still provide a consistent, auditable experience.
Power BI AI Q&A creates visuals from text and Smart Narratives serve different purposes. Q&A turns natural language into visuals (charts, tables, cards), while Smart Narratives turn existing visuals into natural‑language summaries. Together, they support both exploration and explanation.
AI Q&A visual Power BI reports can be safe for production if the underlying model is clean, the questions are guided through training or prompts, and there is a clear owner who reviews suggested views before converting them into fixed visuals.
Natural language visual creation Power BI AI can work across multiple fact and dimension tables if the semantic model is well‑structured with clear relationships. The Q&A engine relies on the model’s logic, so joining tables through proper keys and relationships is essential for accurate results.
Recommended Articles
Continue with these related resources when you want the next practical step in this topic.
Explore the full Power BI Visuals and Reports guide or browse Power BI Resources.