What is the Power BI Smart Narrative?
The Power BI Smart Narrative is a type of data visualization that enables report authors to lay out a quick textual summarization of Power BI reports and visuals based on the underlying data. It provides an innovative way to generate customized and dynamic insights for your end users. You can utilize the Power BI Smart Narrative summaries in your reports to communicate key takeaways from the report, indicate any patterns or trends, and amend the key messaging in a specific format as intended.
Power BI smart narrative visual provides out-of-the-box insights that automatically get updated with every refresh. It eliminates any need to take manual snapshots of key summaries of your report when you add a live Power BI report page to PowerPoint. By using these summaries, you can provide a quick understanding of the underlying dataset, highlight key facts, and pass the critical information to the end users. You can add a Smart Narrative for a page or visual or add a smart narrative icon to a visual in Power BI.
Some of the key features of the Power BI Smart Narrative include:
- Data-driven contextual insights with the ability to customize the text narratives.
- Add dynamic inputs using natural language to add new measures.
- Display summarized data without the need to create any DAX for the calculation.
- Automatic data refresh with change in the underlying dataset.
- Ability to generate text and dynamic values using visual interactions such as cross-filter.
Table of contents
Key Takeaways
- The Power BI Smart Narrative is a quick way of generating customized and dynamic insights for the end users.
- It provides data-driven contextual insights, key takeaways, key messages or metrics, and the ability to add dynamic inputs using natural language.
- With changes to the underlying dataset, the Power BI Smart Narrative can refresh the summary automatically.
- It can also generate text and dynamic values by using visual interactions such as cross-filter
- It can be created for a visual, a report, or even a smart narrative icon for a visual
- Consider the limitations of Power BI Smart Narratives before you recommend using them.
📊 Unlock Advanced DAX Skills in Power BI!
Take your Power BI skills to the next level with our Advanced DAX in Power BI Training Course. Dive deep into advanced DAX functions, complex calculations, and optimization techniques to enhance your data analysis and reporting capabilities.
How to Create the Power BI Smart Narrative?
You can create the Power BI Smart Narrative in both Power BI Desktop and Power BI Service. To create the Power BI Smart Narrative in Power BI Desktop, follow the instructions outlined below:
Creating a Smart Narrative for a Visual
You can create a Power BI smart narrative visual by following the steps below.
Step 1: Import your dataset and load it into the Power BI Desktop.
Step 2: Create a data visualization or report using the visual icons available in the Visualizations pane.
Step 3: Select the visual and right-click on it.
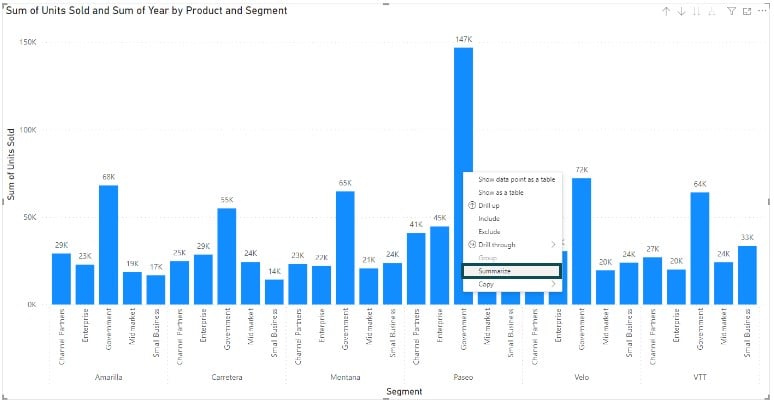
Step 4: Choose the Summarize option from the context menu. It will generate a smart narrative for the selected visual.

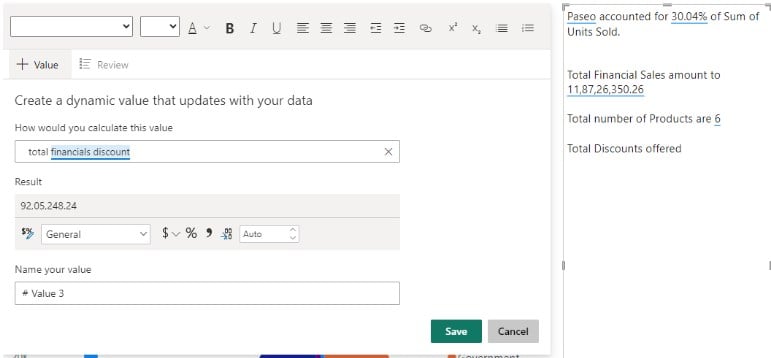
Step 5: Click on + Values to edit changes to the narrative. You can also amend the text in the narrative box by adding your content.

Step 6: Create a dynamic value by typing a value. As you type, a list of suggested values that you can choose for the narrative will appear.
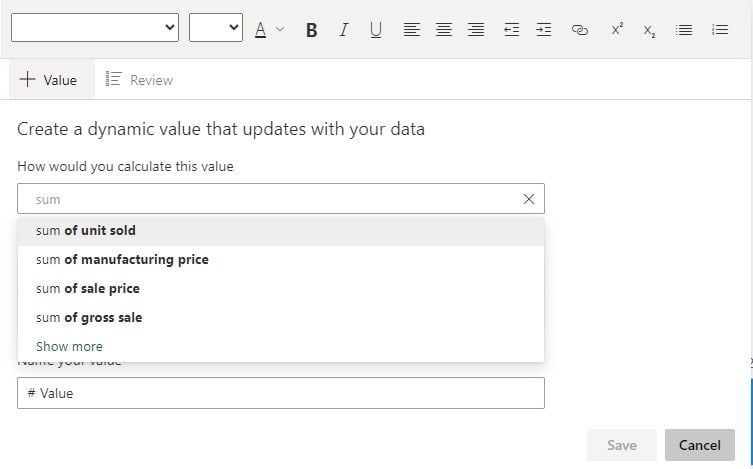
Step 7: Select a value and click on Save to save the changes.

You can see the narrative is updated with the dynamic value you have added.

Note: There is no formal Power BI smart narrative syntax for creating the smart narratives for any visual.
Creating a Smart Narrative for a Page
You can create a smart narrative for a Page by following the steps below
Step 1: Create a data visualization in Power BI Desktop using the imported dataset.
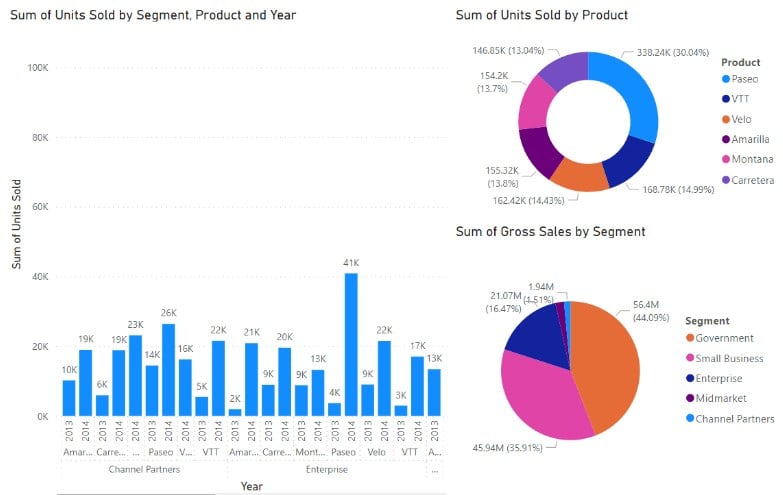
Step 2: Select the report canvas in the Power BI Desktop and then click on the Smart narrative icon from the Visualizations pane.
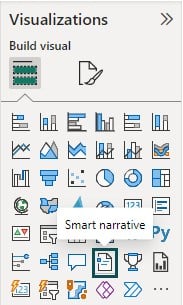
Step 3: This will generate a smart narrative for the Power BI page.

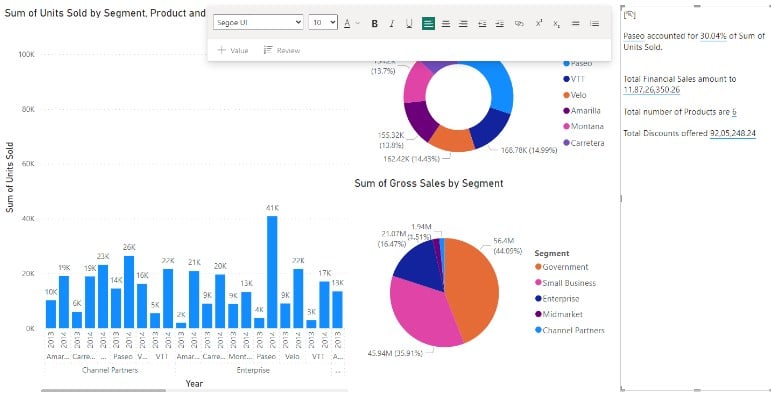
Step 4: Click on the narrative box to amend any text or add dynamic values to the narrative.
As you can see, we have added customized text and included dynamic values to these texts to make a meaningful insight for the end users.
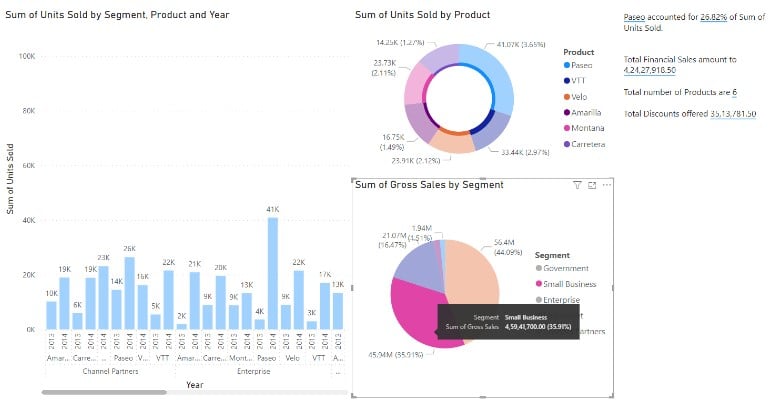
Step 5: Click on any of the visuals to apply cross-filtering. You can see the smart narrative is now updated with the dynamic values based on the context of the value selected.
Adding a Smart Narrative icon to a Visual
You can create a smart narrative for a Page by following the steps below
Step 1: Select a visual and navigate to Format your visual – General tab.
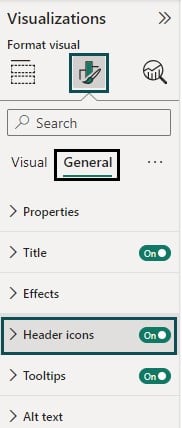
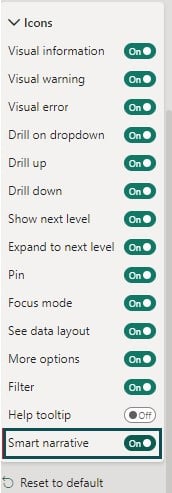
Step 2: Expand the Header icons and then expand the Icons.
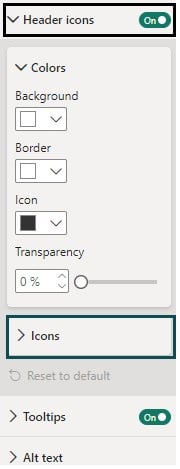
Step 3: Toggle the Smart narrative slider to on.
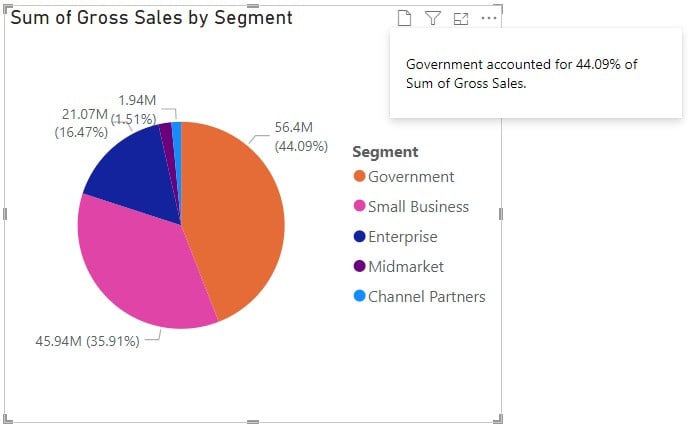
Step 4: Hover your mouse over the visual. You will observe a Smart narrative icon.

Step 5: Click on the Smart narrative icon. You will notice the smart narrative box providing insight into the selected visual.
Note: You can use DAX for Power BI smart narrative if statement to add dynamic inputs for smart narratives.
Examples
In this section, we will understand the Power BI Smart Narrative through some examples.
Example #1 – Smart Narrative for a visual
In this example, we will create a Power BI smart narrative visual using eCommerce Shipping Data. eCommerce Shipping Data contains shipping information for an international eCommerce company.
To create a Power BI smart narrative visual, follow the steps below:
Step 1: Import your dataset and load it into the Power BI Desktop.
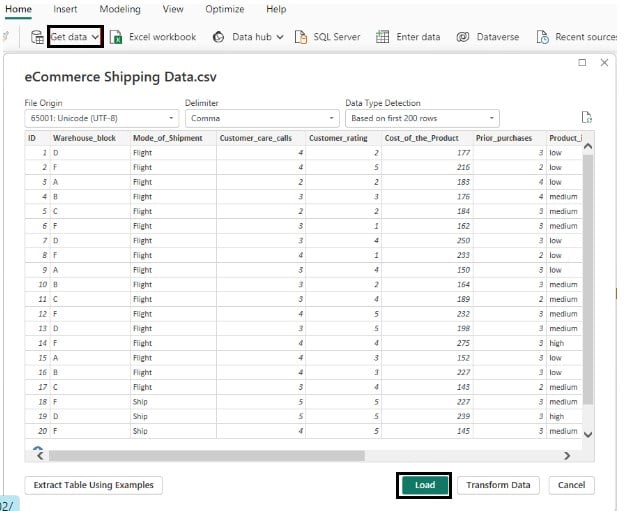
Step 2:
- Navigate to the Visualizations pane.
- Select a visual icon.
- Drag and drop the data fields to the report canvas to map as per the chosen visuals.
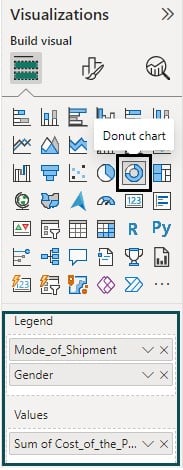
Step 3: Select the visual and right-click on it. It will display a context menu.
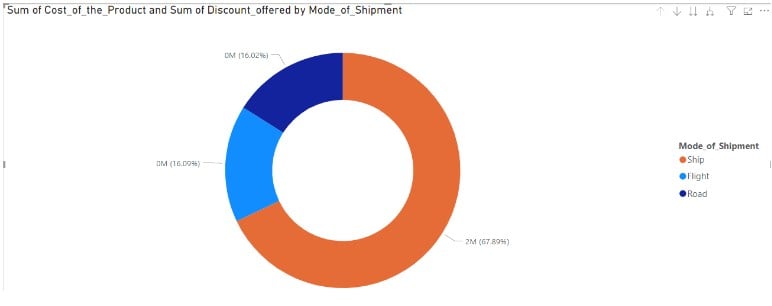
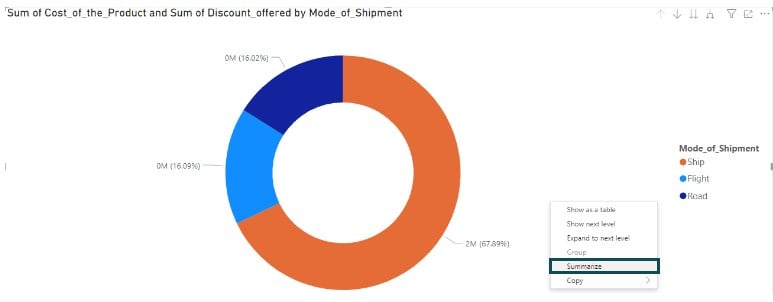
Step 4: Choose the Summarize option from the context menu.
It will generate a smart narrative for the selected visual.
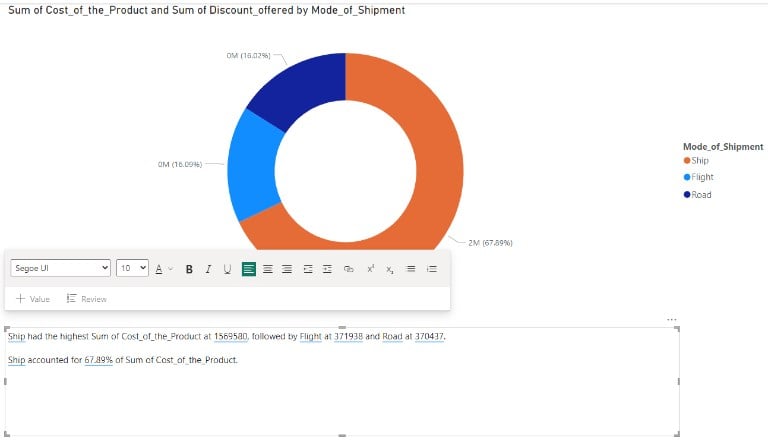
Step 5: Amend the Smart Narrative box by adding the text to your visual. Click on + Values to edit changes to the narrative. Create a dynamic value by typing a value. As you type, a list of suggested values will appear that you can choose for the narrative.
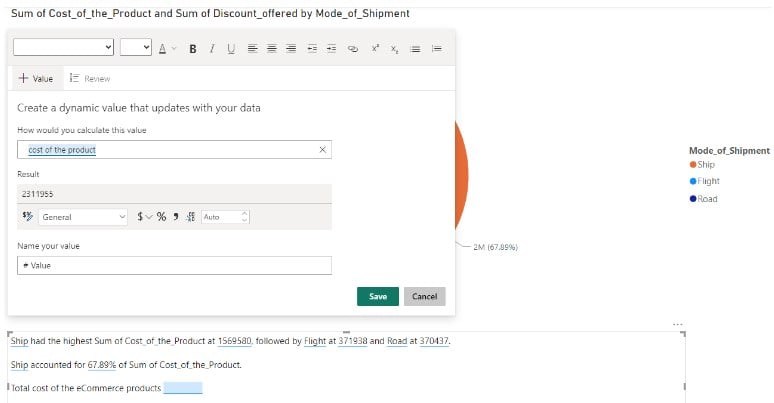
Step 6: Select a value and click on Save to save the changes.
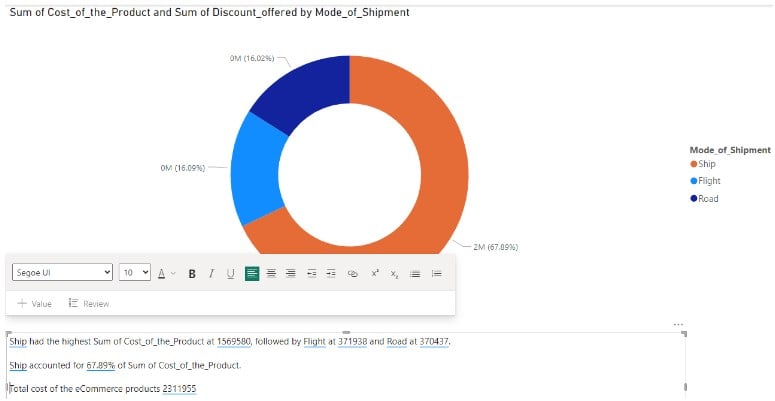
You can see the narrative is updated with the dynamic value you have added.
Step 7: Apply formatting as per your requirements. Click on Save.
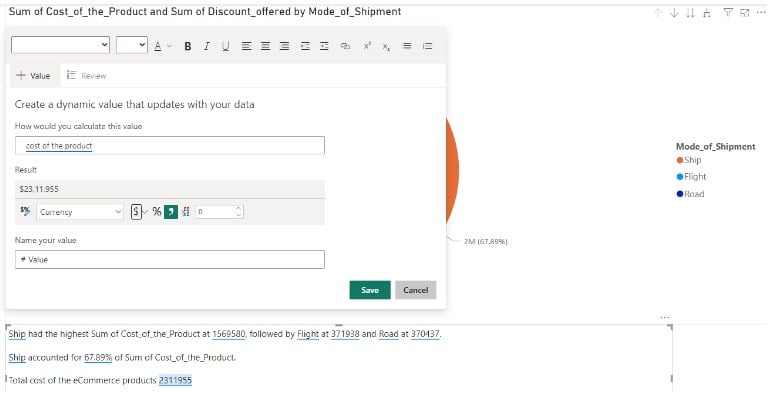
It will update the formatting of your visual.

Example #2 – Smart Narrative for a page
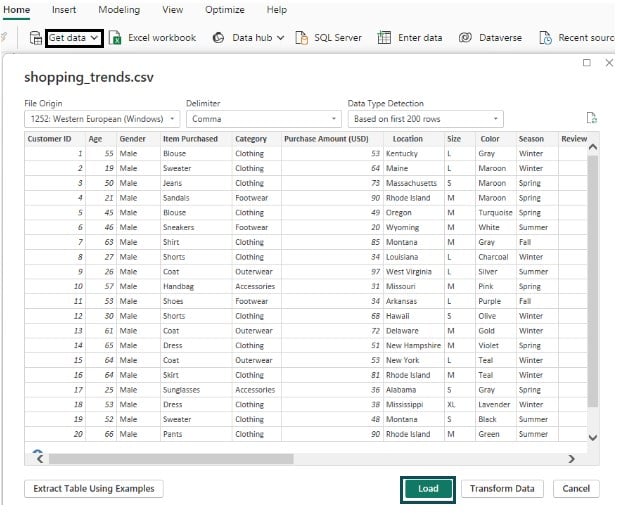
In this example, we will create a Power BI Smart Narrative for a visual using the shopping_trends dataset. The shopping_trends dataset contains the customers’ shopping preferences, offering valuable insights into consumer behavior and purchasing patterns. To create a Power BI Smart Narrative for a page, follow the steps below:
Step 1: Import the dataset into Power BI using the Get data.
Step 2: Navigate to the Visualizations pane, select the visual icons and drag and drop the data fields as per the chosen visual icons.
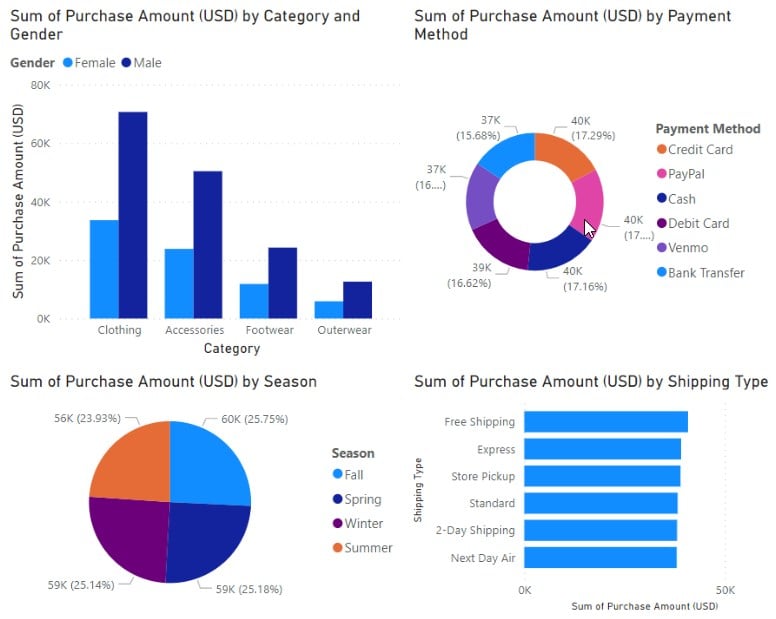
Step 3: Select the report canvas in the Power BI Desktop and then click on the Smart narrative icon from the Visualizations pane.

Step 4: This will generate a smart narrative for the Power BI page.
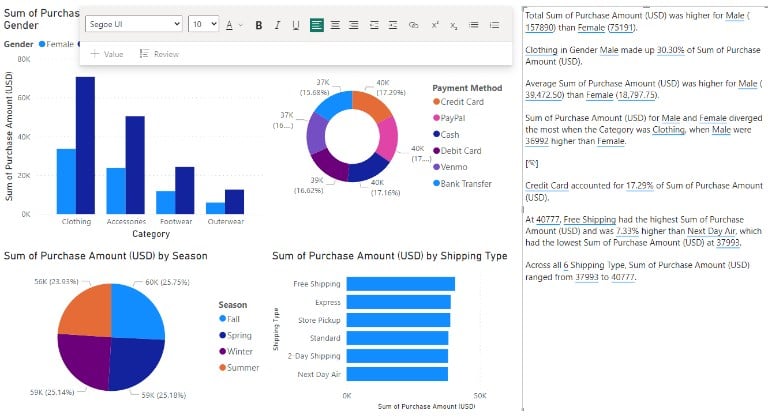
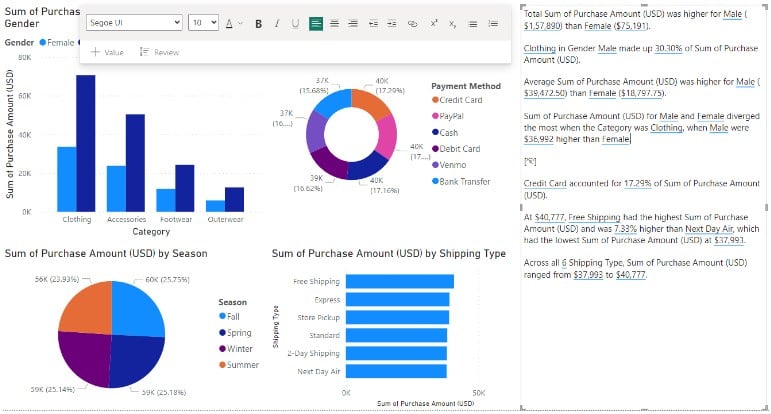
Step 5: Click on the narrative box to amend any text or add dynamic values to the narrative.
As you can see, we have added customized text and included dynamic values to these texts to provide meaningful insight for the end users.
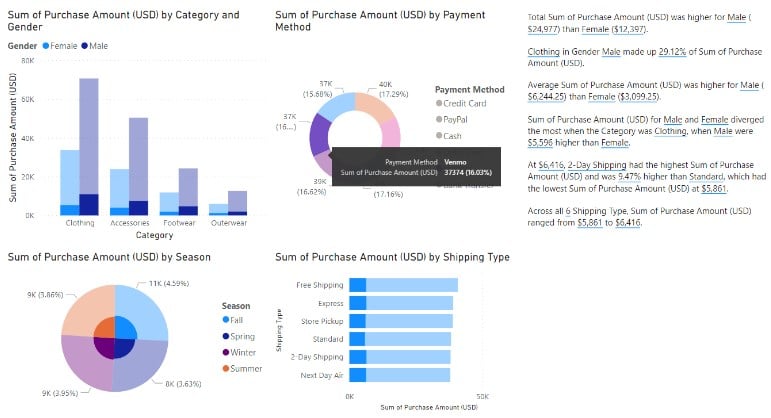
Step 6: Click on any of the visuals to apply cross-filtering. You can see the smart narrative is now updated with the dynamic values based on the context of the value selected.
Example #3 – Smart Narrative icon to a visual
In this example, we will create a smart narrative icon to an existing visual created as part of example -1.
To create a Smart Narrative icon to a visual, follow the steps below:
Step 1: Select a visual and navigate to Format your visual – General tab.
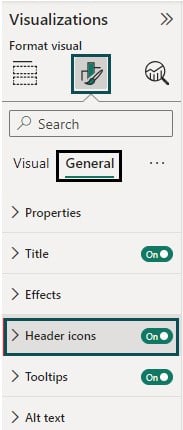
Step 2: Expand the Header icons and then expand the Icons.
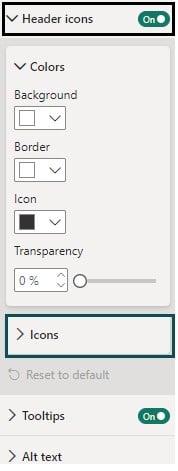
Step 3: Toggle the Smart narrative slider to on.
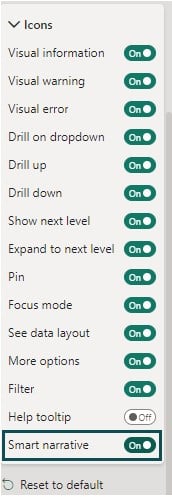
Step 4: Hover your mouse over the visual. You will observe a Smart narrative icon.

Step 5: Click on the Smart narrative icon. You will notice the smart narrative box providing insight into the selected visual.

Note: Several features are not supported in Power BI Smart Narrative, including:
- Dashboard pinning, applying Power BI smart narrative conditional formatting using the dynamic values
- Web publishing, Power BI report server, and On-premises Analysis Services
- Live Connection to Azure Analysis Services or SQL Server Analysis Services
- Map visuals, card visuals with non-numeric measures, and cross-filtering visuals
- Any tables, matrices, visuals with R or Python scripts
- Visuals using dynamic calculations such as QnA Arithmetic, percentage of grand total, etc.
- Dynamically generated values
Important Things to Note
- Power BI Smart Narrative output is dependent on the underlying data quality. Ensure that you have performed data cleaning and transformation to process accurate data for Smart Narrative visuals.
- You can customize the narratives generated by Power BI Smart Narrative to make it user-friendly for your end users.
- If you have any sensitive information, be careful to use Smart Narrative as it may expose your confidential data.
- Microsoft regularly updates the existing Power BI features and introduces new ones. Always refer to the latest Power BI version for using the Power BI Smart Narrative.

Frequently Asked Questions (FAQs)
Yes, you can customize the narratives generated by Power BI Smart Narrative. Some of these customizations include:
• Apply formatting to the narratives such as Font, alignment, color, and other appearance-related changes
• Edit the generated narratives by amending your content and insights
• Create dynamic values that get refreshed with changes to your dataset
• You can also use the General formatting options such as Size, Position, Padding, Adding a Title, alternate text, and enable or disable the smart narrative options to your visual.
Storytelling refers to creating a sequence of data visualizations that are combined to communicate a contextual narrative and demonstrate the chain of events to reach an outcome. Though Power BI Smart Narrative provides you with data-driven contextual insight for your dataset, it doesn’t have a storytelling feature, unlike other visualization tools such as Tableau.
Yes, you can customize the narratives generated by Power BI Smart Narrative. Some of these customizations include:
• creating dynamic insights that get refreshed with changes to data
• Intuitive data visualization by integrating the smart narrative with the Power BI reports
To enable or disable Smart Narrative in your Power BI report, follow the instructions highlighted below:
• Open your Power BI report using the Power BI Desktop.
• Select the visual for which you want to enable or disable the smart narrative.
• Navigate to Format your visual – General. Expand the Header icons – Icons.
• Under the Icons section, toggle on or off the Smart narrative option depending on whether you want to enable or disable your visual in Power BI.
Recommended Articles
This has been a guide to Power BI Smart Narrative. Here we explain how to create smart narrative for visuals & page along with adding icon, examples, and points to remember. You may learn more from the following articles –

Leave a Reply