What is a Power BI Report Server?
Power BI Report Server is an on-premises solution offered by Microsoft for creating, publishing, and managing Power BI reports within an organization’s network. It allows businesses to maintain data and reports on their local servers, providing more control over their data and ensuring compliance with data governance regulations. With Power BI Report Server, you can create paginated reports, mobile reports, and KPIs for your organization.
Table of contents
Key Takeaways
- Power BI Report Server is a valuable solution for organizations that need on-premises control of their data and reports.
- It offers customization, security, and integration with Microsoft services but comes with infrastructure and scalability limitations compared to Power BI Service, a cloud-based alternative.
- Careful consideration of an organization’s specific needs and compliance requirements is essential when choosing between the two options.
- Power BI has multiple components that are integrated into the Power BI Report Server ecosystem.
- You must follow the latest Microsoft documentation to install it in your system.
📊 Unlock Advanced DAX Skills in Power BI!
Take your Power BI skills to the next level with our Advanced DAX in Power BI Training Course. Dive deep into advanced DAX functions, complex calculations, and optimization techniques to enhance your data analysis and reporting capabilities.
Features
The key features of the Power BI Report Server include:
| Category | Description |
|---|---|
| Report Creation | Create interactive and visually appealing reports with Power BI Desktop |
| Data Sources | Connect to various data sources, including databases, cloud services, and on-premises data. |
| Customization | Customize the appearance and branding of reports |
| Security | Implement security measures like role-level security and encryption |
| Scheduled Data Refresh | Schedule data refresh to keep reports up-to-date |
| Mobile Reports | Design and publish mobile-friendly reports |
| Export and Printing | Export reports to various formats and enable printing |
| Integration | Integrate with other Microsoft services like SharePoint |
| Extensibility | Extend functionality through custom visuals and APIs |
Power BI Report Server data sources include a range of different sources that cover databases, online services, and on-premises sources.
Components
Power BI Report Server consists of several components, including:
- Power BI Desktop: The authoring tool for creating reports.
- Power BI Report Server Web Portal: The secure web-based interface for report publishing, on-demand report access and subscription, and management.
- Report Server Database: Stores report metadata and settings.
- Data Sources: Data can come from various sources.
- Client Applications: Tools like Power BI Mobile for viewing reports on mobile devices.
You can perform the Download by navigating to the official Microsoft Power BI Report Server page.
Set Up Requirements
To set up the Power BI Reporting Server, ensure you meet the below requirements:
- .NET Framework (4.8 or higher versions), Minimum 1GB Hard Disk, Minimum 1GB Memory, Minimum: x64 Processor: 1.4 GHz
- x64 Processor: AMD Opteron, AMD Athlon 64, Intel Xeon with Intel EM64T support, Intel Pentium IV with EM64T support
- Windows Server 2016, Windows 10, Windows Server 2019, Windows Server 2022, Windows 11
- SQL Server Database Engine (2014 SP3 or higher) for the Report Server database storage
- SQL Server Analysis Services (2014 SP3 or higher) for any live analysis service data sources
- Installation of Power BI Report Server software.
How to Install Power BI Report Server?
If you are using on-premises reporting with Power BI Report Server, you can use the free trial version. If you want to use the licensed version, then you have to enter the product key. Power BI Report Server Licensing may vary as per your organization’s needs. Microsoft offers its server as part of the SQL Server Enterprise Edition with Software Assurance or through a Power BI Premium Per User (PPU) license.
The installation process can be complex and version-specific, so it’s recommended to follow the official Microsoft documentation for step-by-step instructions on installation. The latest version is Microsoft Power BI Report Server-September 2023, which you can download from Microsoft portal.
Note that Power BI Report Server pricing is dependent on the licensing model you choose. As mentioned, it might be included with SQL Server Enterprise Edition with Software Assurance or offered separately through Power BI Premium Per User (PPU) licensing. The cost of Power BI Report Server pricing can vary based on factors like the number of users, features, and support required. You should refer to Microsoft’s official website or contact Microsoft’s sales team for the latest pricing details.
Architecture
Power BI Report Server architecture involves the components mentioned earlier, with Power BI Desktop for report creation, the web portal for report management, and the Report Server Database for storing metadata and configuration.

Examples
In this section, we will look at some of the examples of Power BI Report Server.
Example #1 – Developing Reports with Power BI Report Server
In this example, we will go through the step-by-step process of building reports with the Power BI Report Server.
To develop reports, follow the steps below:
Step 1: Install the Power BI Desktop application for the Power BI Report Server. You can navigate to web portal and download the latest version of Power BI Report Server-September 2023. Depending on your system, choose either a 32-bit or 64-bit version of Power BI Desktop.

Step 2: Install the Power BI Desktop in your system and then launch it to start building the reports
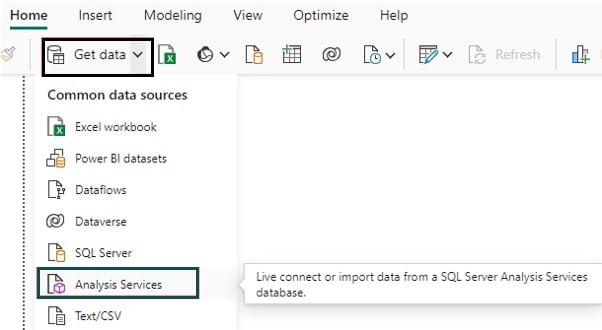
Step 3: Navigate to Home – Get data – Analysis Services
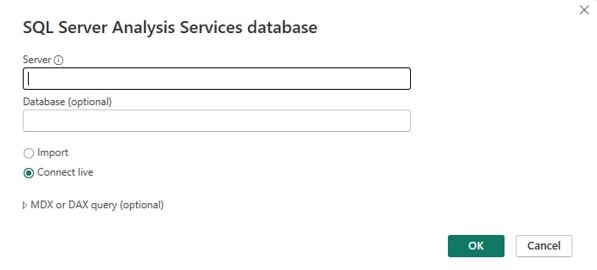
Provide the Server and database details (if applicable), and choose Connection live.
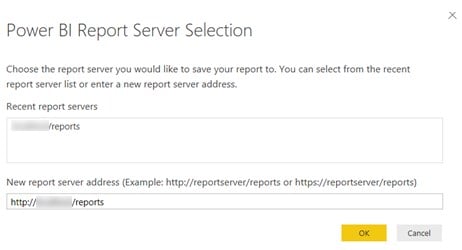
Specify the Report Server to save your reports.
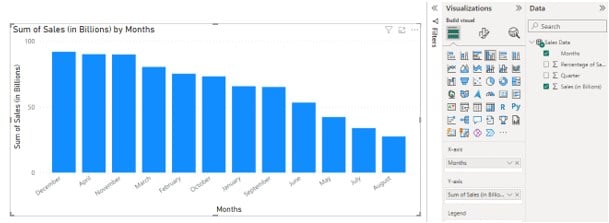
Step 4: Create a data visualization report in Power BI Desktop. It could be any visuals ranging from a column chart, Pie chart, Funnel, etc. as per the reporting requirements.
For this demonstration, we have created a Clustered column chart that shows total sales across different months.
Similarly you can also create a funnel chart of customers and then group values as per their yearly income.

Once the reports are ready then as part of the next steps you can publish them to the Report Server.
Example #2 – Publish Report to the Report Server
In this example, we will go through a step-by-step process of publishing a report to the Report Server.
To publish the report to the Power BI Report Server, follow the steps below:
Step 1: Open Power BI Desktop and import the dataset using the Get data option.
Step 2: Create a data visualization report in Power BI Desktop (refer to Example 1).
Step 3: Once the Power BI report is ready, save it to the Power BI Report Server.
Note this Power BI Report Server is the one that you had provided previously during the Report server setup.

You will be able to view the report in the Power BI Report Server web portal.
Example #3 – Managing Dataset on the Report Server
In this example, we will go through the step-by-step process of managing datasets on the Power BI report server.
The steps to manage datasets are outlined below:
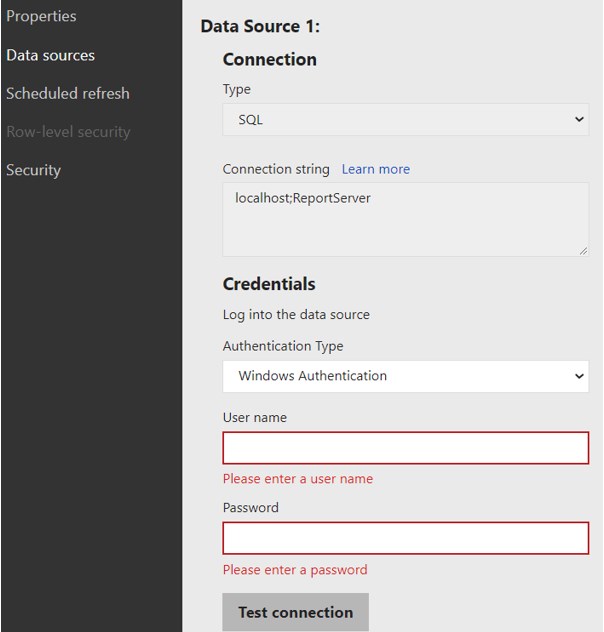
Step 1: Create a SQL Server connection to a server by providing the required details.

Step 2: Navigate to Manage Parameters in Power Query Editor.

Create parameters for both ServerName and Databasename.
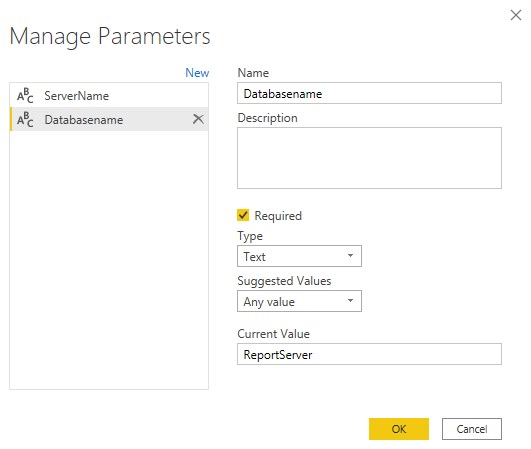
Map the details for the first connection.

Step 3: Publish the report to the server.
Pros and Cons
Some of the key pros and cons of using the Power BI Report Server are outlined below:

Power BI Report Server vs Power BI Service
Some of the key differences between Power BI Report Server and Power BI Service include:
| Parameter | Power BI Report Server | Power BI Service |
|---|---|---|
| Create Bookmarks | No | Yes |
| Licensing Requirements | Power BI Premium or SQL Server EE with Software Assurance (SA) | Power BI Pro and/or Power BI Premium |
| Deployment Type | On-premises or hosted cloud | Cloud |
| Release Frequency | Three times a year | Once a month |
| Ability to create dashboards | No | Yes |
| Using apps to distribute groups of reports | No | Yes |
| Additional features (Q&A, Quick insights) | No | Yes |
| Real-time streaming features | No | Yes |
| Auto data refresh for DataQuery models | No | Yes |
| Email subscriptions – Power BI reports | No | Yes |
| Data analytics scripts (R, Python) | No | Yes |
| Data models (many-to-many relationship) | No | Yes |
| Cross-report Drill through | No | Yes |
| Features such as Data Privacy labels, Sensitivity labels | No | Yes |
| Ability to Preview | No | Yes |
| Row-level security feature | No | Yes |
Important Things to Note
- Regularly update the Power BI Report Server for security and feature enhancements.
- Understand the data source and network requirements for seamless connectivity.
- Ensure data governance and compliance with organizational policies.
- Data with current layout option for all Power BI visuals, including the improvements to the Export to Excel experience for Power BI table and matrix visuals. Only the Summarized data option is supported within the Power BI Report Server.

Frequently Asked Questions (FAQs)
To upgrade the Power BI Report Server, follow these general steps:
• Ensure you have a backup of your encryption keys, existing Power BI Report Server database and configuration files.
• Download the latest version from the Microsoft Download Center.
• Identify the location of the PowerBIReportServer.exe, run the installer, and choose the Upgrade Power BI Report Server option.
• Follow the installation wizard’s instructions, accept the license terms and conditions, and then choose Upgrade.
• After the upgrade is complete, you may need to reconfigure your server settings and reports by selecting Configure Report Server to launch the Reporting Services Configuration Manager or selecting Close to exit the installer.
Power BI Report Server primarily focuses on hosting and rendering Power BI reports, and it does not offer the same dashboard creation capabilities as Power BI Service. However, you can create interactive reports with visuals and data visualizations in Power BI Desktop and publish those reports to the Power BI Report Server. Users can then access and interact with these reports through the web portal.
Yes, the Power BI Report Server does support DirectQuery. With DirectQuery, your report can connect directly to your data source, sending queries to the source in real time. This allows you to work with large and up-to-date datasets without importing the data into the Power BI model. You can set up DirectQuery connections in Power BI Desktop and then publish the report to the Power BI Report Server for on-premises consumption.
Power BI Report Server does not offer the same automatic data refresh capabilities as Power BI Service. Data refresh typically needs to be handled manually or through other methods.
Some of the common reasons why the Power BI Report Server does not refresh include:
• 3rd party driver related issues that can be fixed through proper installation.
• Memory pressure may require additional memory and resources impacting the reports to render and also may result in report failures with potential crashes of the report server. This can be fixed through correct deployment.
• Issues related to Kerberos configuration may impact data refresh.
• There are specific settings that may impact scheduled refresh which include settings set within SQL Server Management Studio (SSMS)
Recommended Articles
This has been a guide to Power BI Report Server. Here we learn the requirements, features, components, Architecture, with examples, and how to install them. You can learn more from the following articles –

Leave a Reply