
Introduction to AI-Powered Excel Charting
With the advent of Artificial Intelligence (AI), it has stormed its way into every aspect of our life. While we have been using Excel for visualizations and insights since a long time, creating charts for data analysis is easier than ever before. AI can revolutionize the way you create charts and Excel AI graphing 2026. In this article, we will explore the cutting-edge world of AI-powered charts and graphs in excel and also empower you with the skills to harness their potential within the familiar confines of Microsoft Excel.
In this article, we discuss how you can use AI to create advanced, dynamic charts and transform your data into insightful visualizations.
AI-powered Excel charts are useful because they automate the process of data visualization that is otherwise time-consuming. They can easily and instantly identify key trends, and provide charts through simple conversations. Their generated charts are complex and professional even when you write your prompts in plain English. They act as an intelligent assistant, removing the need for manual chart configuration, formula generation, or advanced data skills.
Native Excel AI Charting Features
Most of the AI agents powering Excel come with the following features that make creation of visuals a simple task compare t manually creating them.
The features include:
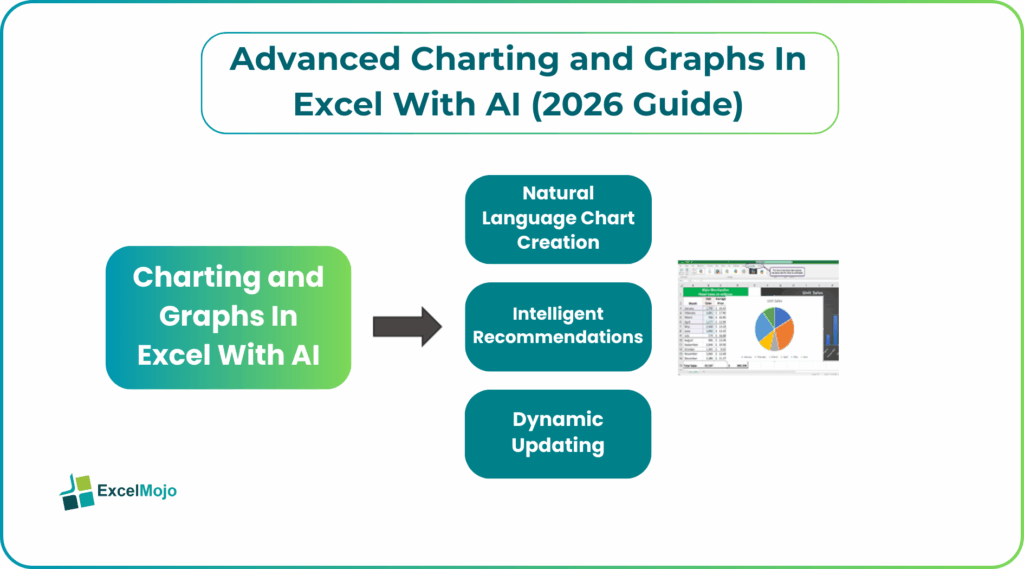
- Natural Language Chart Creation: Users can simply type requests in plain English. It can be something simple like “Create a bar chart showing sales by region” to generate visuals instantly.
- Intelligent Recommendations: They can analyze data patterns to suggest the most appropriate chart types for your dataset.
- Automatic Data Identification: The AI can recognize raw data structures and automatically select the relevant data ranges for plotting.
- Dynamic Updating: Charts generated through AI are connected to the underlying data. They are automatically refreshed when the data changes.
- Contextual Insight Generation: Copilot can identify trends, outliers, and patterns. For instance, they may create a line chart for you to detect a spike in sales.
#1 – Copilot Chart Recommendations
Copilot in Microsoft 365 provides intelligent, AI-driven chart recommendations by analyzing data patterns, identifying trends, and suggesting appropriate visualizations. It is is very useful for creating professional presentations quickly, saving roughly 45-60 minutes per presentation.
Best Practices for Copilot Chart Generation
To get the best results in dynamic Excel graphs AI, use a structured prompt formula (Type + Data + Audience) rather than simple requests:
- Specify the chart type you need. (e.g., “Create a clustered bar chart…”)
- Specify the context of the data: (.comparing 2024 and 2025 revenue by region…)
- Define the audience or goal (.for a CFO presentation.”)
Example Prompt: “Create a line chart with data markers showing monthly market share percentage for three competitors over 24 months, with a trend line for our company highlighted in blue, designed for an investor presentation”.
There are many recommended charts based on the purpose for which we use it.
Copilot can generate a wide range of charts in Excel and PowerPoint to suit different analytical needs:
Trends over time: Line charts with markers.
Comparisons: Clustered bar charts.
Composition: Stacked bar charts or pie charts.
Relationships: Scatter plots.
Financial Data: Waterfall charts are recommended for showing value creation.
#2 – Analyze Data Visual Suggestions
One can analyze data visual suggestions in Excel using AI. For this, you can use the built-in Analyze Data feature or Copilot advanced charts. It leverages natural language to explore datasets without manual formatting. To perform analysis, start by ensuring your data is in a clean, tabular format with unique headers. In the “Analyze Data” pane, review the suggested pivot tables and charts, which identify trends, patterns, and outliers automatically.
You can further refine these suggestions by asking specific questions in plain English to get more tailored outputs from the AI Excel visualization tools. Finally, validate these AI-driven insights with your own knowledge and experience. Thus, the suggested chart type must accurately represent the underlying data structure.
Key Steps for Analysis:
- Format the data s a table by using Ctrl+T to make data “AI-ready”.
- Click on “Analyze Data” on the Home tab to see pre-built insights.
- Ask natural language questions to generate required advanced Excel charts AI.
- Validate the output by ensuring that the AI’s suggested chart type accurately reflects the data pattern.
Top AI Add-ins for Advanced Graphs
AI-powered add-ins are transforming spreadsheet data into useful visualizations. They not just generate basic charts, but also allow Excel to provide actionable insights and automated design. The top tools in this category in 2026 focus on natural language, automated cleaning, and presentation-ready outputs. Let us look at the same.
#1 – SheetAI Chart Pro
SheetAI.app is an add-on for Google Sheets that uses AI, and can also work in Excel. It can automate data cleaning, create formulas, and make charts using natural language commands. It has a unique function =SHEETAI() to analyze trends and generate advanced Excel charts AI. Anyone can work on it, even those without coding knowledge. It is best suited for Google Workspace users who need a tool for data automation, cleaning, and quick charting.
#2 – Powerdrill Advanced Visuals
Powerdrill Bloom is an AI data exploration tool in 2026. It turns Excel, CSV, or PDF files into interactive visuals and presentation slides. This feature generates PowerPoint slides and data preview images. It suggests the best chart type based on the data. Users can ask questions in plain language to generate charts and get insights. It is best suited for business professionals, marketers, and analysts who need to create reports quickly.
Best Practices & Customization
Creating advanced Excel charts AI brings a new dimension to data visualization, allowing for dynamic insights and predictive analytics. This guide will walk you through the process of merging Excel and AI for visualization.
Ensure you have the latest version of Excel that supports AI features. If not, you must update your software to access the latest features
You must install AI-specific add-ins that are compatible with Excel. Thus, you can leverage the capabilities of Excel combined with AI.
Using the Import feature of Excel, you can get your dataset into Excel. This is best suited compared to manual entry.
You must check for configurations to enhance efficiency.
Ensure your data is well-organized within Excel using tables, labels, and consistent formatting. This a helps in manipulation and data analysis.
Employ Excel functions or AI-powered tools to identify and handle missing data.
Ensure uniform data formats across columns for seamless integration with AI algorithms.
Evaluate your data to determine the most suitable AI-powered chart type.
Based on your analysis goals, choose the appropriate AI-driven chart type like predictive analytics, anomaly detection, clustering, etc.
You can adjust AI algorithms by changing the parameters to align with your data specifics for accuracy.
You can boost the appearance of your chart with colors, labels and visual elements.
Enhance user engagement by adding interactive elements. You can also enable real-time updates to keep the chart up to date. Verify the accuracy of your AI-powered chart by comparing insights against known patterns.
Frequently Asked Questions (FAQs)
AI improves Excel charting by automating data selection, chart creation, and trend detection through natural language prompts. It eliminates manual formatting and instantly generates professional, dynamic visuals that update automatically with data changes.
Native Excel AI features like Copilot and Analyze Data help with intelligent chart recommendations, while add-ins such as SheetAI and Powerdrill Bloom enable advanced visuals, automated cleaning, and presentation-ready charts using plain English commands.
AI can generate dynamic and interactive dashboards by linking charts directly to live data tables. These dashboards update in real time and can include insights, highlights, and visuals generated through conversational AI queries.