


Introduction
Power BI dashboards are built with numerous charts, tables, and KPI cards for financial requirements. However, translating those visuals into clear, narrative‑driven explanations still requires manual effort. Analysts and controllers frequently rewrite the same patterns, “Revenue grew by X% driven by Y” or “Profit margin declined due to rising costs in Z,”for each period, which is time‑consuming and prone to inconsistency. Power BI Smart Narratives Copilot auto‑report writing addresses this by using Microsoft’s Smart Narratives feature. Combined with Copilot‑assisted text generation, it produces concise, automated summaries of key metrics and trends. When tied to specific visuals or report pages, this approach can generate near‑immediate, consistent narratives that complement the charts and support governance‑level reporting.
This article explains how to use Power BI Smart Narratives with Copilot to create AI auto‑report writing Power BI Smart Narratives. These turn visual insights into short, readable summaries, wire them into report layouts, and avoid common pitfalls around tone and precision. Smart Narratives area way to generate natural‑language descriptions for visuals, which makes it a natural fit for automated report narratives Power BI Copilot workflows. For data‑focused professionals, that means less time rewriting commentary and more time focusing on the underlying assumptions and business context behind the numbers.
What Smart Narratives and Copilot do in Power BI Smart Narratives Copilot Auto‑Report Writing
Smart Narratives in Power BI is a built-in capability that analyzes the data behind a visual and generates a short paragraph describing the main drivers, trends, or outliers. It can work at the visual level, providing a one‑paragraph blurb, or at the page level, summarizing multiple charts into a longer narrative block. The text is generated from the visual’s aggregation logic, including filters, hierarchies, and slicer selections, so the story automatically updates when the user changes the context.
Copilot for Power BI enhances this by letting users prompt‑driven explanations, such as:
- “Summarize the top three drivers of this variance in one sentence.”
- “Rewrite this narrative in a more formal tone for a board‑level update.”
The combination of Power BI Copilot Smart Narratives insights and the native Smart Narratives layer allows analysts to both auto‑generate and then refine the narrative to match the audience’s tone and level of detail for Power BI Smart Narratives Copilot Auto‑Report Writing.
How to Generate Auto‑Generated Narratives for Power BI Smart Narratives Copilot Auto‑Report Writing
Using Power BI Smart Narratives Copilot auto‑report writing follows a structured workflow that blends native UI‑driven generation with AI‑assisted editing.
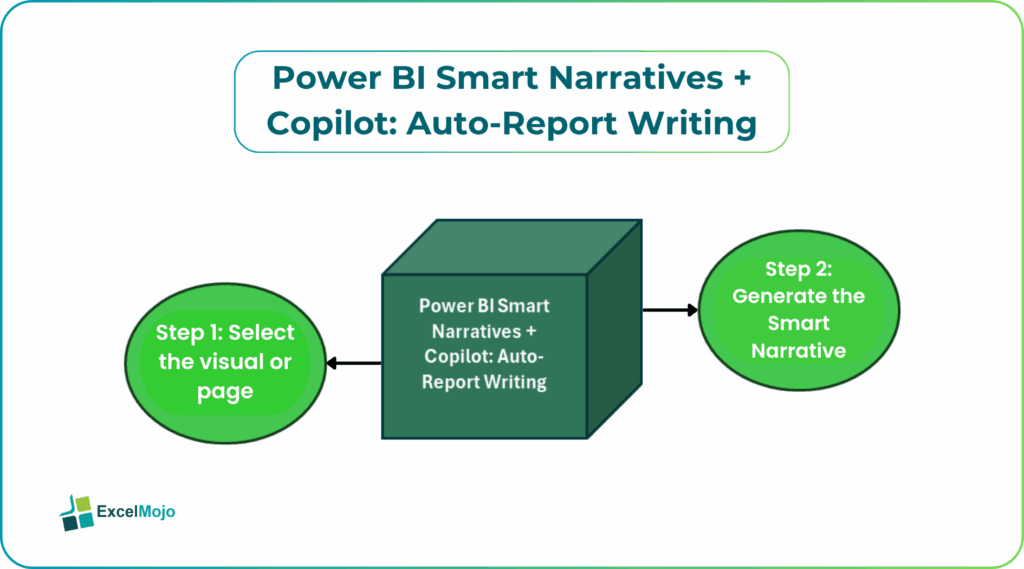
Step 1: Select the Visual or Page
Choose the chart, KPI, or table whose story the narrative should explain. This is typically the same visual that appears in the main dashboard area and that is already filtered by the relevant time range, segment, or scenario for Power BI Smart Narratives Copilot Auto‑Report Writing.
Step 2: Generate the Smart Narrative
- In Power BI Desktop, right‑click the visual and select Create Smart Narrative (or go through the Insert menu in the current version).
- Power BI generates a default paragraph that highlights the largest contributors, the direction of change, and any notable outliers.
- Place the narrative text box near the visual so that the story sits alongside the chart rather than buried in a separate section.
This generated text forms the baseline for AI auto‑report writing Power BI Smart Narratives and can be reused across similar visuals with only minor wording changes.
Step 3: Use Copilot to Refine or Extend the Narrative
Once the narrative exists, analysts can use Copilot‑style prompts to:
- Shorten long explanations.
- Add or remove references to specific segments or regions.
- Adapt the language for different audiences (e.g., technical vs. executive).
Copilot does not always replace the native Smart Narratives; instead, it complements the auto‑generated text by editing it into a more polished, role‑specific version that fits the broader report.
Practical Example: A Board‑Level Bariance Commentary
A common finance scenario is a monthly variance report where the dashboard shows budget versus actuals for revenue, profit, and headcount, and the narrative explains why each metric changed. Using Power BI Smart Narratives with Copilot, the workflow becomes automated: Power BI generates the initial explanations, and Copilot helps refine them into clear, consistent commentary.
- Generate a Smart Narrative for each KPI card, letting Power BI highlight the main drivers.
- Link the narratives to the relevant slicers and filters so that the story updates when the user switches to a different region or scenario.
- Use Copilot‑assisted prompts to condense the combined narratives into a single, board‑ready paragraph that summarizes the key points across the page.
This workflow is a practical example of automated report narratives Power BI Copilot and demonstrates how analyst time can be shifted from repetitive phrasing to validating assumptions and refining the logic behind the numbers.
Pitfalls and Best Practices
Power BI Smart Narratives Copilot auto‑report writing can speed up commentary generation but also introduces subtle risks.
One common issue with Power BI Smart Narratives Copilot Auto‑Report Writing is over‑prescriptive language. AI‑generated narratives may phrase results as definitive conclusions when the underlying data is more exploratory. Analysts should treat the text as a first‑draft narrative and explicitly add words such as “suggests” or “consistent with” when the evidence is not conclusive.
Another risk is tone misalignment.The default Smart Narratives or Copilot‑generated text may be too technical or too informal for the target audience. Best practice is to define a short style guide for commentary (for example, “use active voice, avoid passive constructions, keep sentences under 25 words”) and apply it consistently across reports.
A third pitfall is over‑reliance on automated stories. Turning on Smart Narratives for every visual can dilute the report’s focus. Teams should limit narratives to key visuals that drive decision‑making and keep the remaining charts supported by tooltips or compact legends rather than full‑length stories.
Frequently Asked Questions (FAQs)
Power BI Smart Narratives with Copilot can replace routine, repetitive commentary but should not fully replace human judgment. The AI‑generated text is best used as a first draft that analysts review, refine, and contextualize with business knowledge and governance‑level caveats.
AI auto‑report writing Power BI Smart Narratives produce narrative‑style summaries tailored to specific visuals or pages, while Q&A visuals focus on ad‑hoc question‑and‑answer patterns over the model. The two features often complement each other: narratives explain the “why,” and Q&A lets users drill into the “what‑if” aspects.
Power BI Copilot Smart Narratives insights can be suitable for governance‑level reports if the generated text is reviewed for accuracy, tone, and alignment with corporate language standards. Teams should also document the logic behind the numbers and treat the narrative as an explanatory layer rather than a standalone decision rule.
Yes, automated report narratives Power BI Copilot can adapt to different audiences by rewriting the same underlying story in multiple tones (e.g., detailed technical, concise executive, or regulatory‑style). This is most effective when the analyst defines clear style‑guides and uses consistent prompts across the portfolio of reports.
Recommended Articles
Continue with these related resources when you want the next practical step in this topic.
- Power BI Tutorial
- Getting Started with Power BI
- Power BI Features
- Power BI Desktop Installation
- Data Types in Power BI
Explore the full Power BI Basics and Comparisons guide or browse Power BI Resources.